试玩opentracing-walkthrough
「opentracing-walkthrough」1是一个opentracing的use case example,这篇文章记录一下对这个example project的试玩过程。
先是把「jaegertracing」2给运行起来:
$ docker run -d -p 5775:5775/udp -p 16686:16686 jaegertracing/all-in-one:latest
25af3f00e893a4130f53bd5c7cbe7d1df237b017044f6d4ed53abec91e380c52
这个项目提供实现了opentracing标准的tracing服务。上面的docker命令运行起来以后,可以查看container的状态:
$ docker ps
CONTAINER ID        IMAGE                             COMMAND                  CREATED             STATUS              PORTS                                                                                  NAMES
25af3f00e893        jaegertracing/all-in-one:latest   "/go/bin/standalone-l"   53 minutes ago      Up 53 minutes       5778/tcp, 0.0.0.0:5775->5775/udp, 14268/tcp, 6831-6832/udp, 0.0.0.0:16686->16686/tcp   sick_poitras
接下来把「opentracing-walkthrough」1这个项目checkout,进行编译,然后运行:
$ mvn exec:exec
执行状态如下:
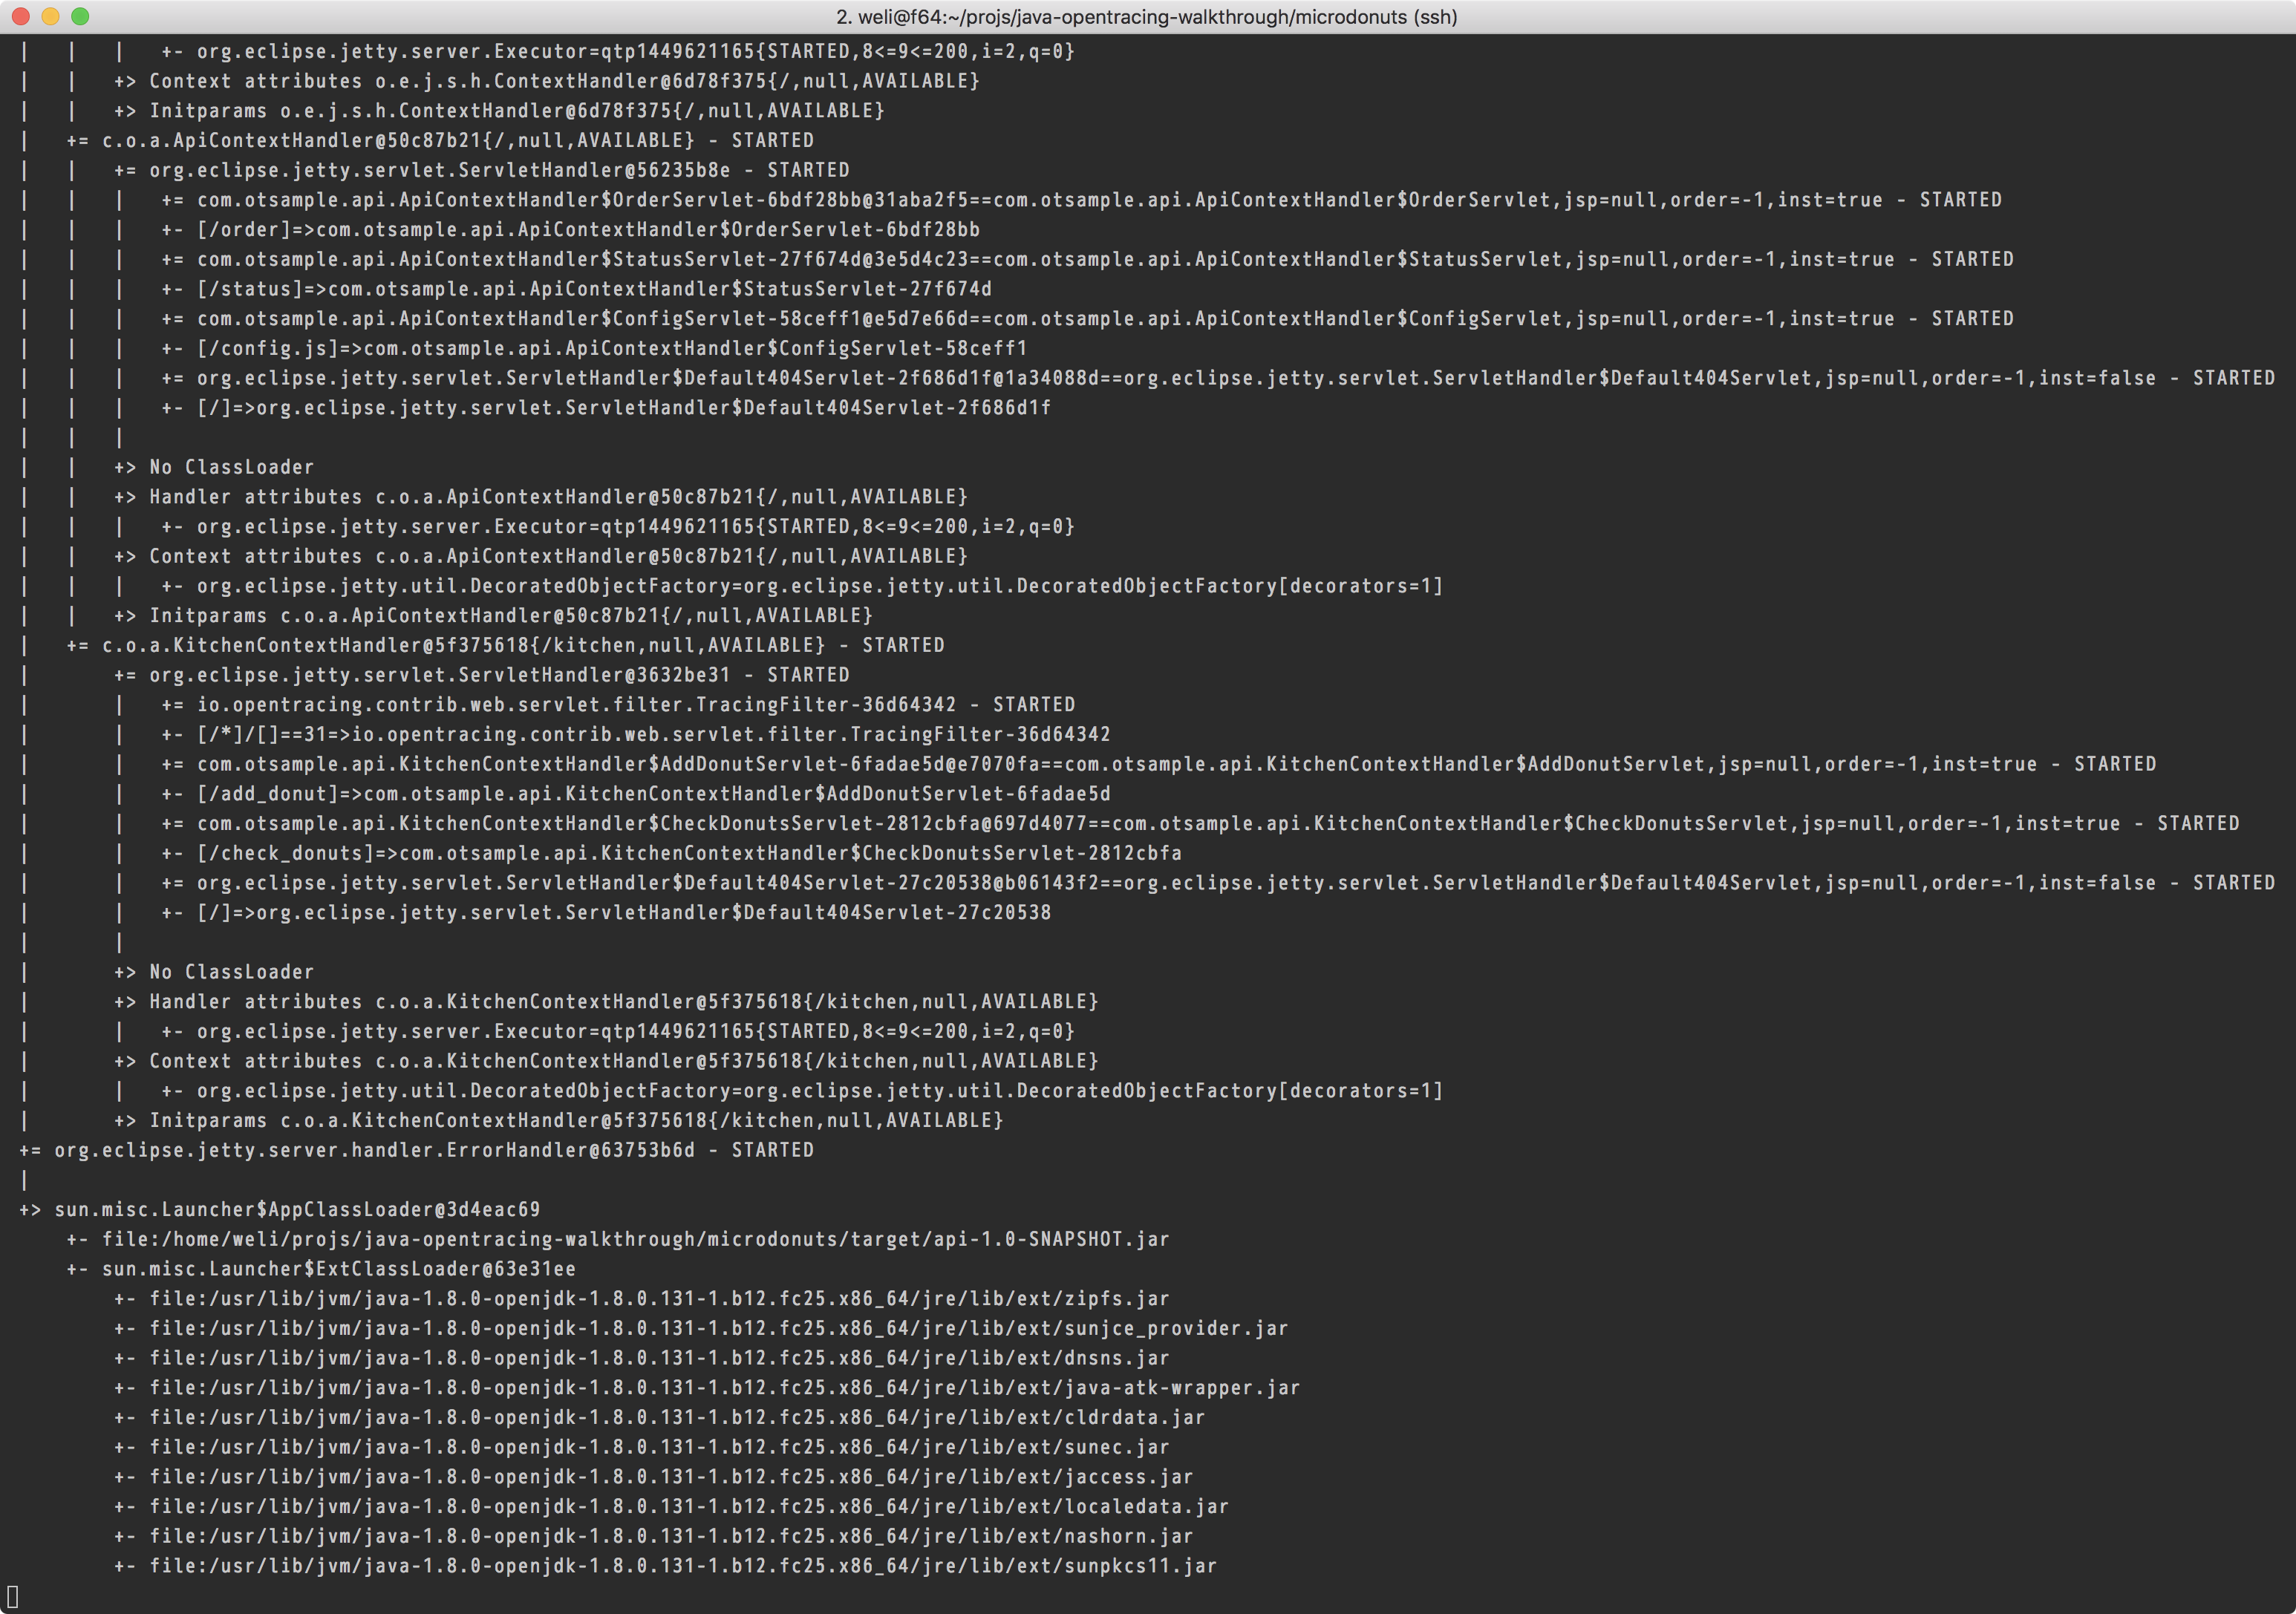
此时访问服务:
http://127.0.0.1:10001/
效果如下:
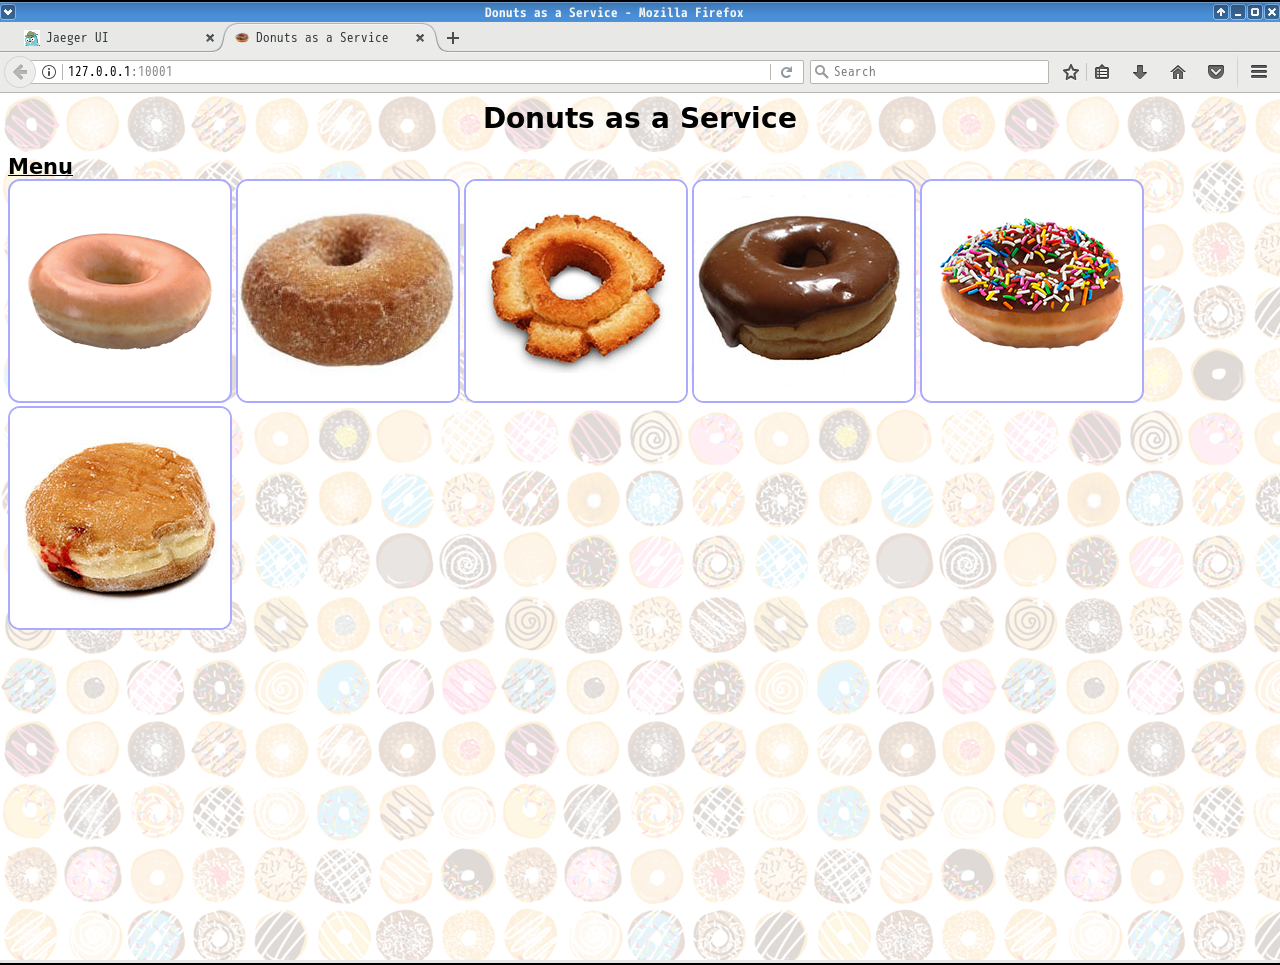
试着在里面order几个donuts。此时jaegertracing会trace这个过程,可以访问jaegertracing的服务端口,进行trace log的查看:
http://localhost:16686
效果如下:
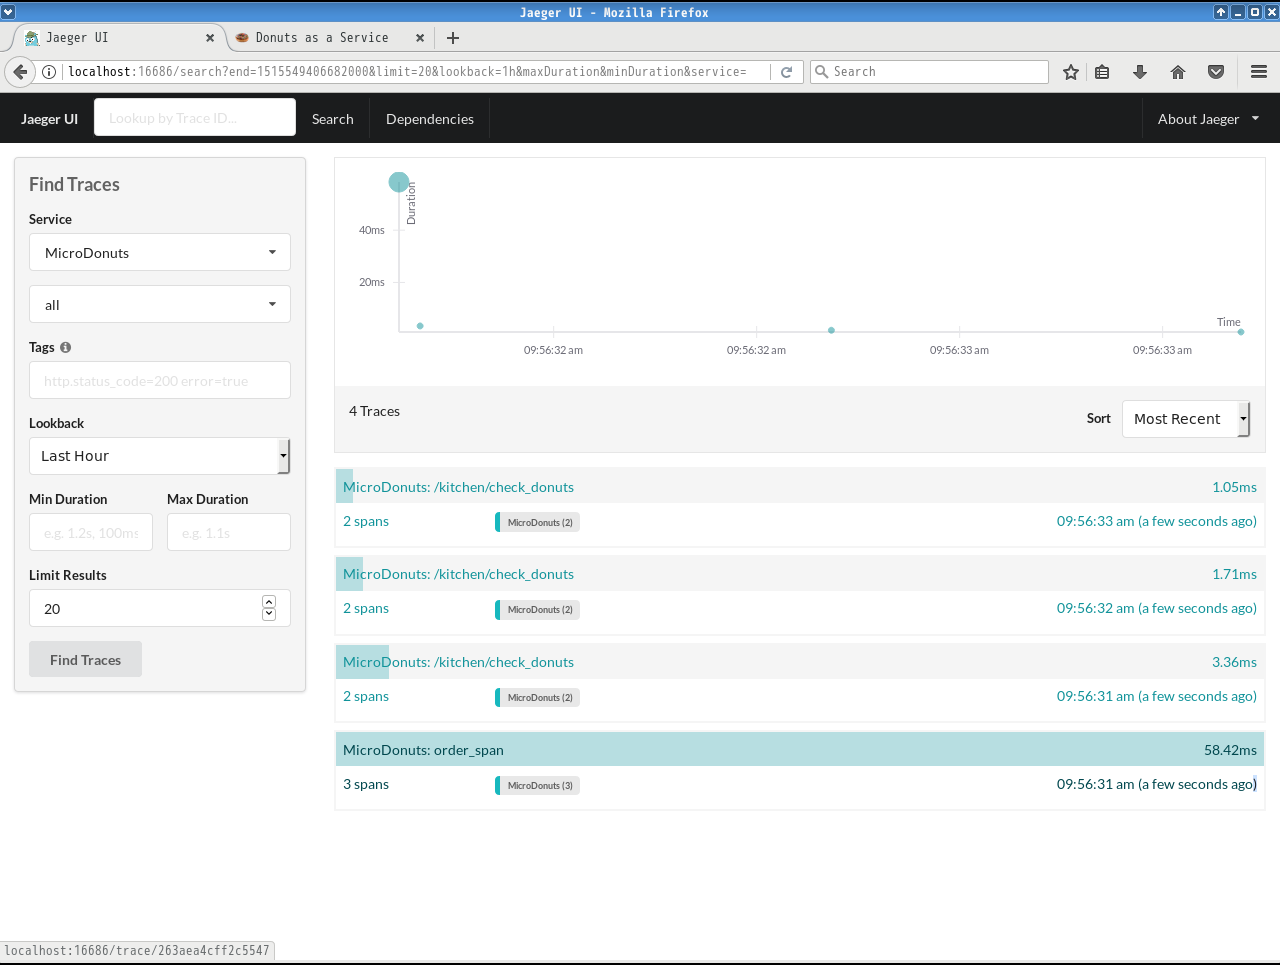
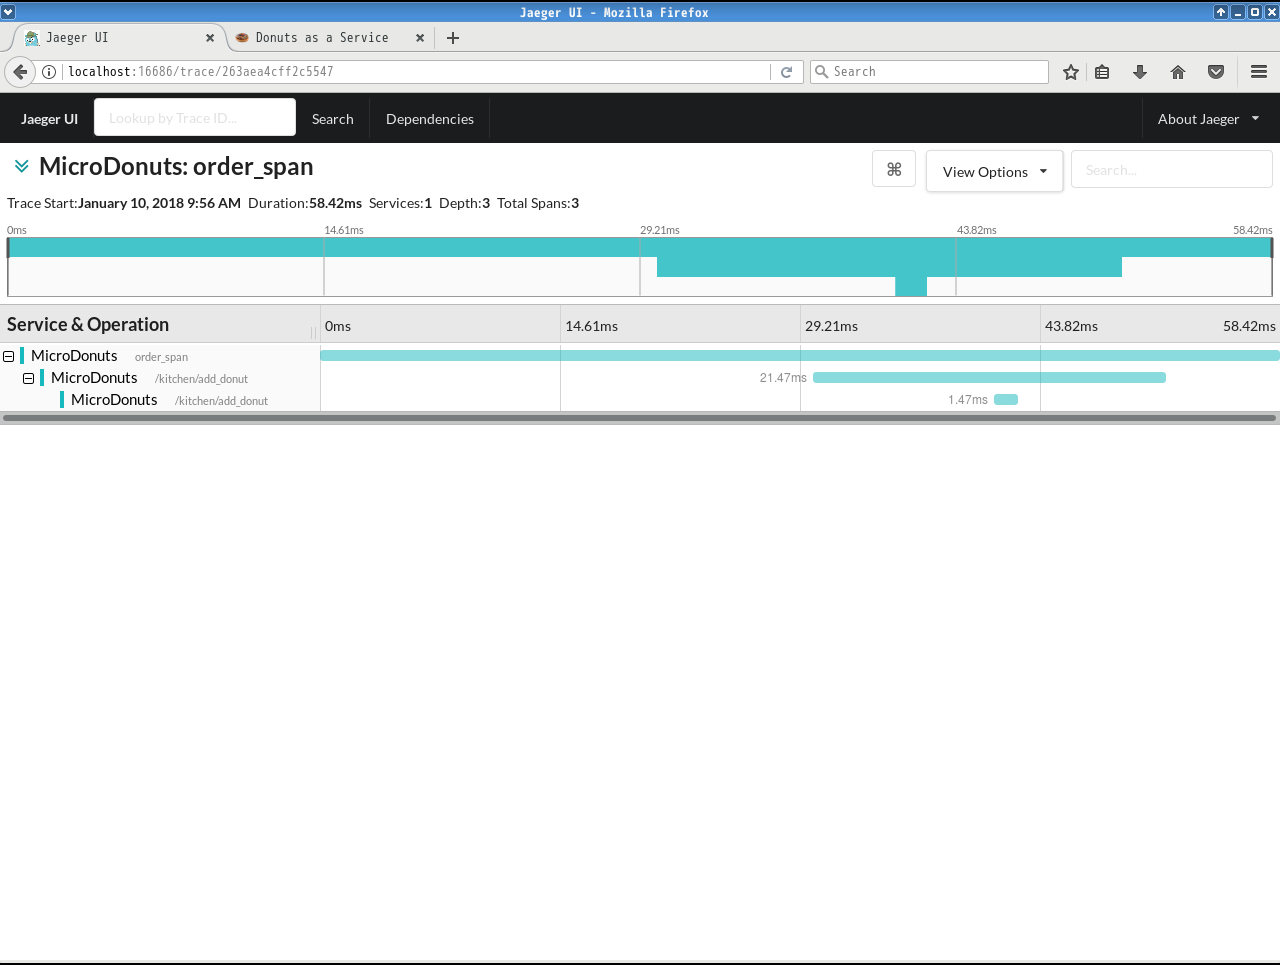
如上图所示,注意要选取「Service」为「MicroDonuts」才可以看到相关的日志。此时还可以查看具体的spans:
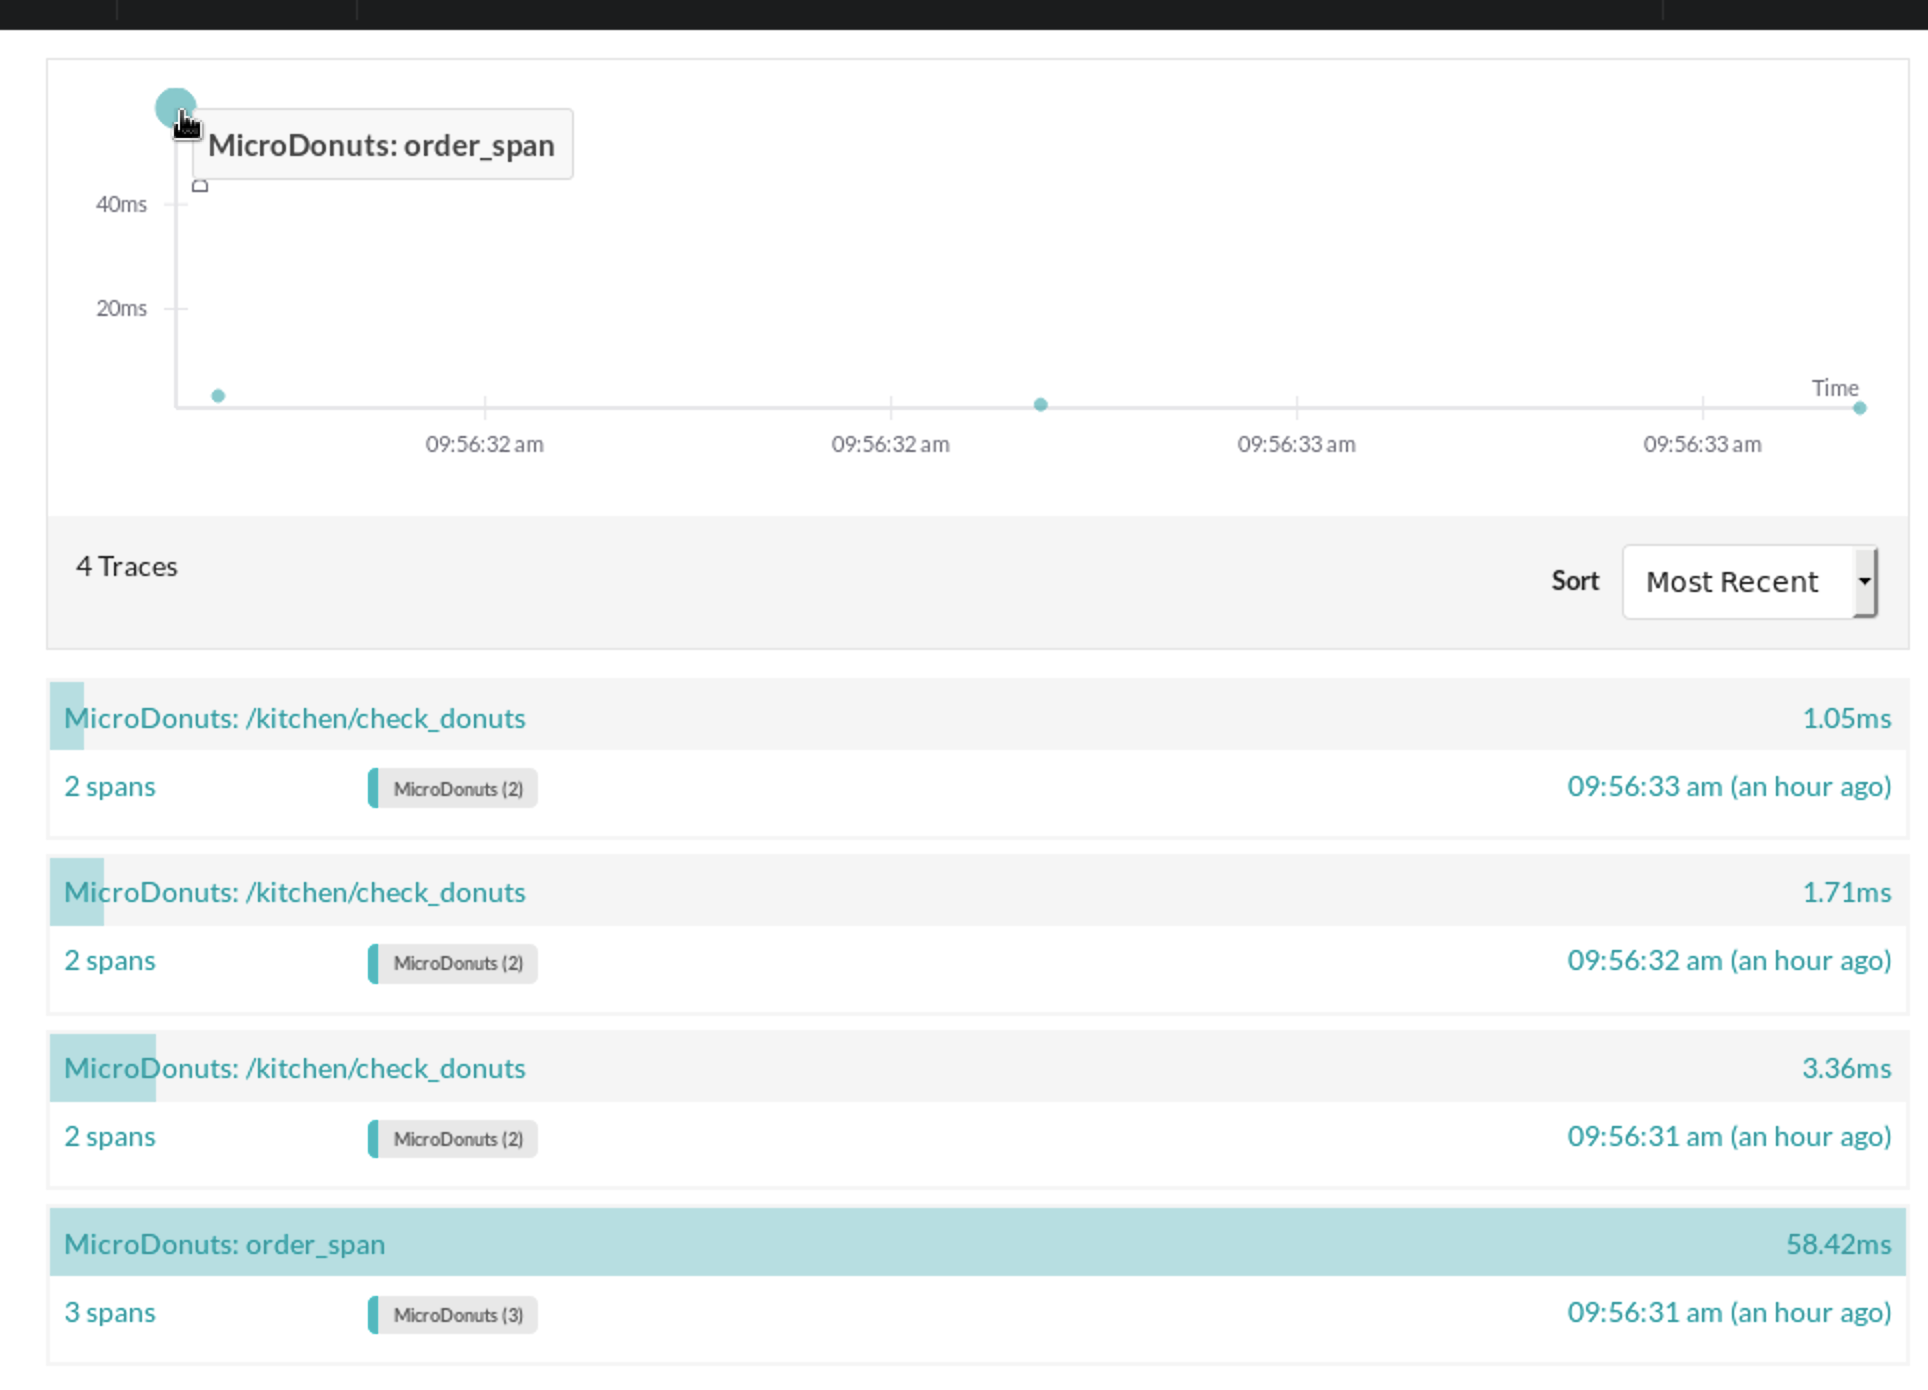
如上图所示,点击这个圆点,进入查看所包含的具体spans,截图如下:
以上是「opentracing-walkthrough」这个项目的基本试玩过程。