Troubleshooting the Wildfly startup process
Troubleshooting the Wildfly startup process
In this article, I’d like to introduce to you how to using the standard Java Debug Wire Protocol(See JavaTM Debug Wire Protocol) to connect to troubleshoot the Wildfly server in standalone mode. The first step is to look into the standalone.sh script provided by the server.
Analyzing the standalone startup script
In standalone.sh, it provides a debug option --debug for the users to debug their applications deployed in server. Here is the relative code:
# Use --debug to activate debug mode with an optional argument to specify the p\
ort.
# Usage : standalone.sh --debug
#         standalone.sh --debug 9797

# By default debug mode is disabled.
DEBUG_MODE="${DEBUG:-false}"
DEBUG_PORT="${DEBUG_PORT:-8787}"
The debug option will enable the DEBUG_MODE in the script. Here is the relative code in the script:
# Set debug settings if not already set
if [ "$DEBUG_MODE" = "true" ]; then
    DEBUG_OPT=`echo $JAVA_OPTS | $GREP "\-agentlib:jdwp"`
    if [ "x$DEBUG_OPT" = "x" ]; then
        JAVA_OPTS="$JAVA_OPTS -agentlib:jdwp=transport=dt_socket,address=$DEBUG\
_PORT,server=y,suspend=n"
    else
        echo "Debug already enabled in JAVA_OPTS, ignoring --debug argument"
    fi
fi
As the script shown above, we can see the debug mode will add the jdwp option into JAVA_OPTS:
JAVA_OPTS="$JAVA_OPTS -agentlib:jdwp=transport=dt_socket,address=$DEBUG_PORT,server=y,suspend=n"
The above options will be finally passed to the startup command in the script:
# Execute the JVM in the background
   eval \"$JAVA\" -D\"[Standalone]\" $JAVA_OPTS \
      \"-Dorg.jboss.boot.log.file="$JBOSS_LOG_DIR"/server.log\" \
      \"-Dlogging.configuration=file:"$JBOSS_CONFIG_DIR"/logging.properties\" \
      -jar \""$JBOSS_HOME"/jboss-modules.jar\" \
      $MODULE_OPTS \
      -mp \""${JBOSS_MODULEPATH}"\" \
      org.jboss.as.standalone \
      -Djboss.home.dir=\""$JBOSS_HOME"\" \
      -Djboss.server.base.dir=\""$JBOSS_BASE_DIR"\" \
      "$SERVER_OPTS" "&"
The above command will start the Wildfly in standalone mode. We can see the jboss-modules.jar is the entry point of the application server. We can’t find the --debug option in domain.sh, because if the application server is running in domain mode, there will be multiple processes run, and domain.sh can’t know which thread you want to debug. So in this article, I will focus on the standalone mode of Wildfly. The --debug option provided by standalone.sh sets the suspend=n. This setting will not block the server start process and will allow the server to start normally whiling waiting for debug request. Here is the server startup process with --debug option enabled:
 $ ./standalone.sh --debug
 =========================================================================

   JBoss Bootstrap Environment

   JBOSS_HOME: /Users/weli/projs/WFLY/wildfly10/wildfly-10.1.0.Final

   JAVA: /Library/Java/JavaVirtualMachines/jdk1.8.0_66.jdk/Contents/Home/bin/java

   JAVA_OPTS:  -server -Xms64m -Xmx512m -XX:MetaspaceSize=96M -XX:MaxMetaspaceSize=256m -Djava.net.preferIPv4Stack=true -Djboss.modules.system.pkgs=org.jboss.byteman -Djava.awt.headless=true -agentlib:jdwp=transport=dt_socket,address=8787,server=y,suspend=n

 =========================================================================

 "/Library/Java/JavaVirtualMachines/jdk1.8.0_66.jdk/Contents/Home/bin/java" -D"[Standalone]" -server -Xms64m -Xmx512m -XX:MetaspaceSize=96M -XX:MaxMetaspaceSize=256m -Djava.net.preferIPv4Stack=true -Djboss.modules.system.pkgs=org.jboss.byteman -Djava.awt.headless=true -agentlib:jdwp=transport=dt_socket,address=8787,server=y,suspend=n "-Dorg.jboss.boot.log.file=/Users/weli/projs/WFLY/wildfly10/wildfly-10.1.0.Final/standalone/log/server.log" "-Dlogging.configuration=file:/Users/weli/projs/WFLY/wildfly10/wildfly-10.1.0.Final/standalone/configuration/logging.properties" -jar "/Users/weli/projs/WFLY/wildfly10/wildfly-10.1.0.Final/jboss-modules.jar" -mp "/Users/weli/projs/WFLY/wildfly10/wildfly-10.1.0.Final/modules" org.jboss.as.standalone -Djboss.home.dir="/Users/weli/projs/WFLY/wildfly10/wildfly-10.1.0.Final" -Djboss.server.base.dir="/Users/weli/projs/WFLY/wildfly10/wildfly-10.1.0.Final/standalone"
 Listening for transport dt_socket at address: 8787
 20:06:48,337 INFO  [org.jboss.modules] (main) JBoss Modules version 1.5.2.Final
 20:06:50,548 INFO  [org.jboss.msc] (main) JBoss MSC version 1.2.6.Final
 20:06:50,611 INFO  [org.jboss.as] (MSC service thread 1-6) WFLYSRV0049: WildFly Full 10.1.0.Final (WildFly Core 2.2.0.Final) starting
 ...
 20:07:06,717 INFO  [org.jboss.as] (Controller Boot Thread) WFLYSRV0025: WildFly Full 10.1.0.Final (WildFly Core 2.2.0.Final) started in 19442ms - Started 476 of 732 services (416 services are lazy, passive or on-demand)
From the above server output, we can see the command to invoke the server in standalone mode is:
"/Library/Java/JavaVirtualMachines/jdk1.8.0_66.jdk/Contents/Home/bin/java" -D"[Standalone]" -server -Xms64m -Xmx512m -XX:MetaspaceSize=96M -XX:MaxMetaspaceSize=256m -Djava.net.preferIPv4Stack=true -Djboss.modules.system.pkgs=org.jboss.byteman -Djava.awt.headless=true -agentlib:jdwp=transport=dt_socket,address=8787,server=y,suspend=n "-Dorg.jboss.boot.log.file=/Users/weli/projs/WFLY/wildfly10/wildfly-10.1.0.Final/standalone/log/server.log" "-Dlogging.configuration=file:/Users/weli/projs/WFLY/wildfly10/wildfly-10.1.0.Final/standalone/configuration/logging.properties" -jar "/Users/weli/projs/WFLY/wildfly10/wildfly-10.1.0.Final/jboss-modules.jar" -mp "/Users/weli/projs/WFLY/wildfly10/wildfly-10.1.0.Final/modules" org.jboss.as.standalone -Djboss.home.dir="/Users/weli/projs/WFLY/wildfly10/wildfly-10.1.0.Final" -Djboss.server.base.dir="/Users/weli/projs/WFLY/wildfly10/wildfly-10.1.0.Final/standalone"
We can see the jdwp port has been opened in above process. In addition, the debug port has been opened:
Listening for transport dt_socket at address: 8787
However, the startup process is not blocked and the server has been started normally. This is okay because most users wants to troubleshoot their own projects deployed in the Wildfly, so the server startup process don’t need to be blocked. However, if we want to troubleshoot the Wildfly server startup process itself, then we need to put the server into blocking mode so we can start a debugger to connect to the jdwp debug port of the server during startup process. To achieve the goal, we need to change the --debug option in standalone.sh slightly. We need to edit the JAVA_OPTS in DEBUG_MODE and change the suspend setting from suspend=n to suspend=y. In this way, we can block the server startup process. After making the change, we can start the server in standalone mode with --debug option enabled, and here is the output:
$ ./standalone.sh --debug
=========================================================================

  JBoss Bootstrap Environment

  JBOSS_HOME: /Users/weli/projs/WFLY/wildfly10/wildfly-10.1.0.Final

  JAVA: /Library/Java/JavaVirtualMachines/jdk1.8.0_66.jdk/Contents/Home/bin/java

  JAVA_OPTS:  -server -Xms64m -Xmx512m -XX:MetaspaceSize=96M -XX:MaxMetaspaceSize=256m -Djava.net.preferIPv4Stack=true -Djboss.modules.system.pkgs=org.jboss.byteman -Djava.awt.headless=true -agentlib:jdwp=transport=dt_socket,address=8787,server=y,suspend=y

=========================================================================

"/Library/Java/JavaVirtualMachines/jdk1.8.0_66.jdk/Contents/Home/bin/java" -D"[Standalone]" -server -Xms64m -Xmx512m -XX:MetaspaceSize=96M -XX:MaxMetaspaceSize=256m -Djava.net.preferIPv4Stack=true -Djboss.modules.system.pkgs=org.jboss.byteman -Djava.awt.headless=true -agentlib:jdwp=transport=dt_socket,address=8787,server=y,suspend=y "-Dorg.jboss.boot.log.file=/Users/weli/projs/WFLY/wildfly10/wildfly-10.1.0.Final/standalone/log/server.log" "-Dlogging.configuration=file:/Users/weli/projs/WFLY/wildfly10/wildfly-10.1.0.Final/standalone/configuration/logging.properties" -jar "/Users/weli/projs/WFLY/wildfly10/wildfly-10.1.0.Final/jboss-modules.jar" -mp "/Users/weli/projs/WFLY/wildfly10/wildfly-10.1.0.Final/modules" org.jboss.as.standalone -Djboss.home.dir="/Users/weli/projs/WFLY/wildfly10/wildfly-10.1.0.Final" -Djboss.server.base.dir="/Users/weli/projs/WFLY/wildfly10/wildfly-10.1.0.Final/standalone"
Listening for transport dt_socket at address: 8787
After changing the suspend setting to suspend=y, we can see the server is blocked during startup process, and now we can use a debugger to connect to the server and set breakpoints to the startup code of the Wildfly.
Troubleshooting the server
To troubleshoot the server itself, we need to get the source code of the Wildfly. We need to make sure the source code we are using has the same version with the Wildfly server we are running. In the Wildfly project download page, we can always download the server and its source code in same version. Here is the the screenshot from the Wildfly download page(http://wildfly.org/downloads/):
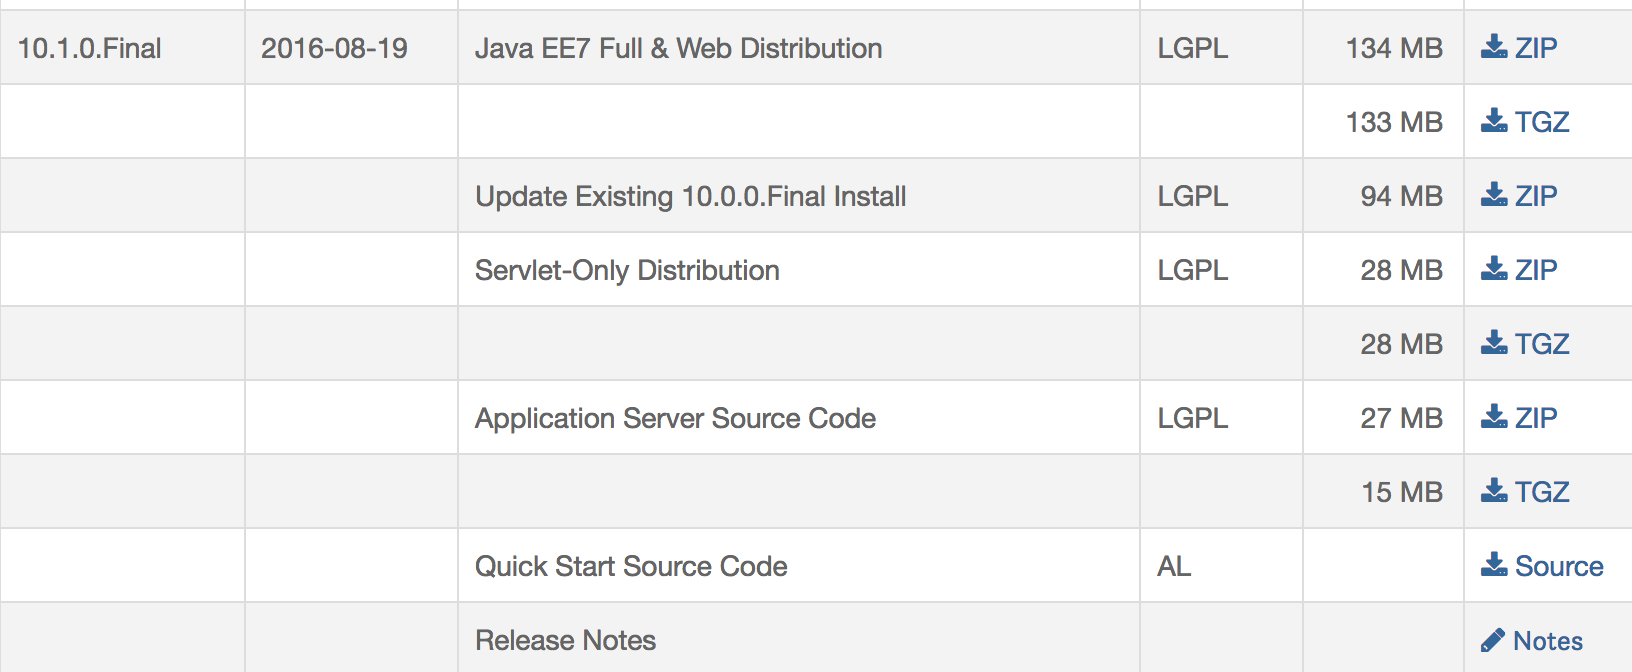
From the above screenshot, we can see for each version of Wildfly, there is a Full Distribution download link and a Source Code download link. We can download both of them to make sure we have same version of source code and server binary. Another way is to compile the Wildfly server from source code cloned from Github(Fetching and compiling the Wildfly upstream source).
After getting the correct version of the source code, we can open it in an IDE and set breakpoints to the source code for debugging. In this article, I will use IntelliJ IDEA and my IDE, and I will use wildfly-10.1.0.Final and its source for demonstration:
$ ls
wildfly-10.1.0.Final         wildfly-10.1.0.Final-src.zip
wildfly-10.1.0.Final-src     wildfly-10.1.0.Final.zip
I opened the above wildfly-10.1.0.Final-src in IntelliJ, and set some breakpoints in org.jboss.as.connector.subsystems.datasources.JdbcDriverAdd class. Here is the screenshot:
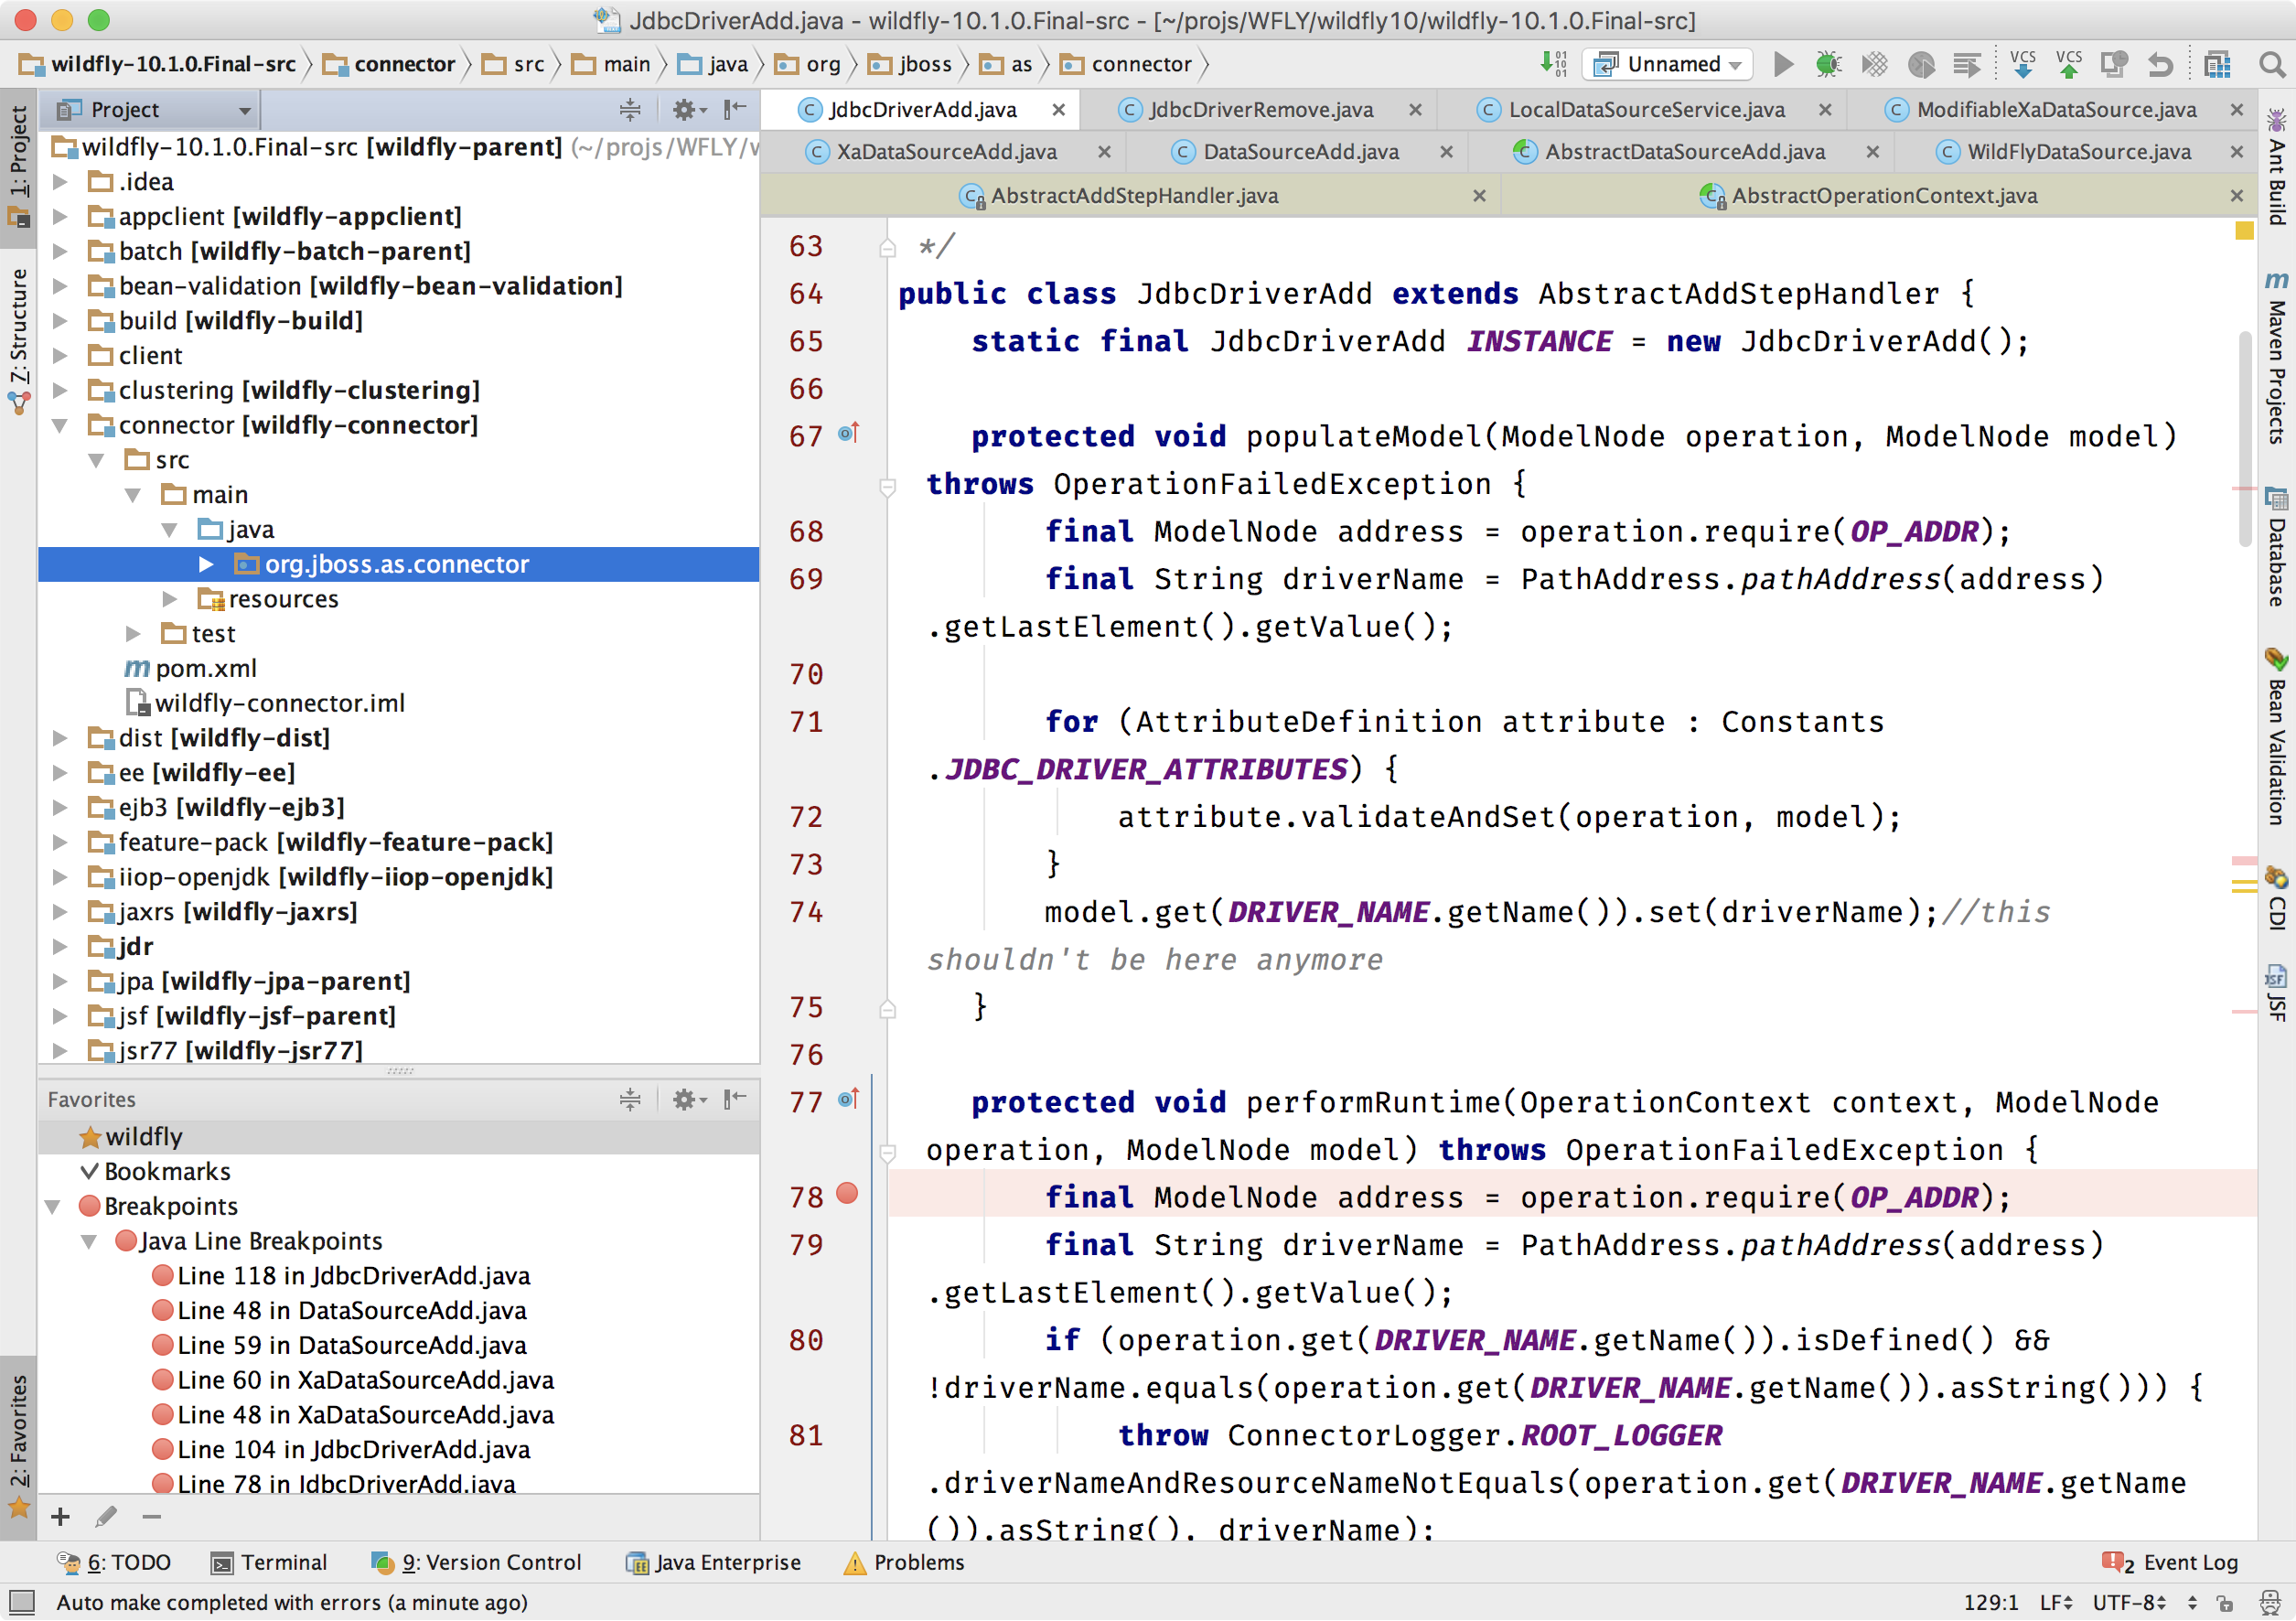
The above screenshot shows one of the breakpoints I set in the org.jboss.as.connector.subsystems.datasources.JdbcDriverAdd class of the Wildfly. This class will load the database driver configured in standalone.xml during server startup process. The standalone.xml is the configuration file of the standalone mode of the server. This file is in the following location of the server:
wildfly-10.1.0.Final/standalone/configuration/standalone.xml
The above configuration file contains the datasources section for the users to configure their database connections. Here is the configuration provided by default:
<datasource jndi-name="java:jboss/datasources/ExampleDS" pool-name="ExampleDS" enabled="true" use-java-context="true">
    <connection-url>jdbc:h2:mem:test;DB_CLOSE_DELAY=-1;DB_CLOSE_ON_EXIT=FALSE</connection-url>
<driver>h2</driver>
    <security>
        <user-name>sa</user-name>
        <password>sa</password>
    </security>
</datasource>
The above configuration defines a ExampleDS datasource, and it is backed by a driver configuration listed in below:
<driver name="h2" module="com.h2database.h2">
    <xa-datasource-class>org.h2.jdbcx.JdbcDataSource</xa-datasource-class>
</driver>
The above configuration defines the database driver to be used by the datasource. We don’t have to understand the details now, and we just need to know Wildfly will load the database driver during its startup process, and the processing class is org.jboss.as.connector.subsystems.datasources. Now we can start the server with --debug option, and change the debug option in standalone.sh from suspend=n to suspend=y as we learned. Here is the server running with --debug option enabled and put in suspend mode during startup process:
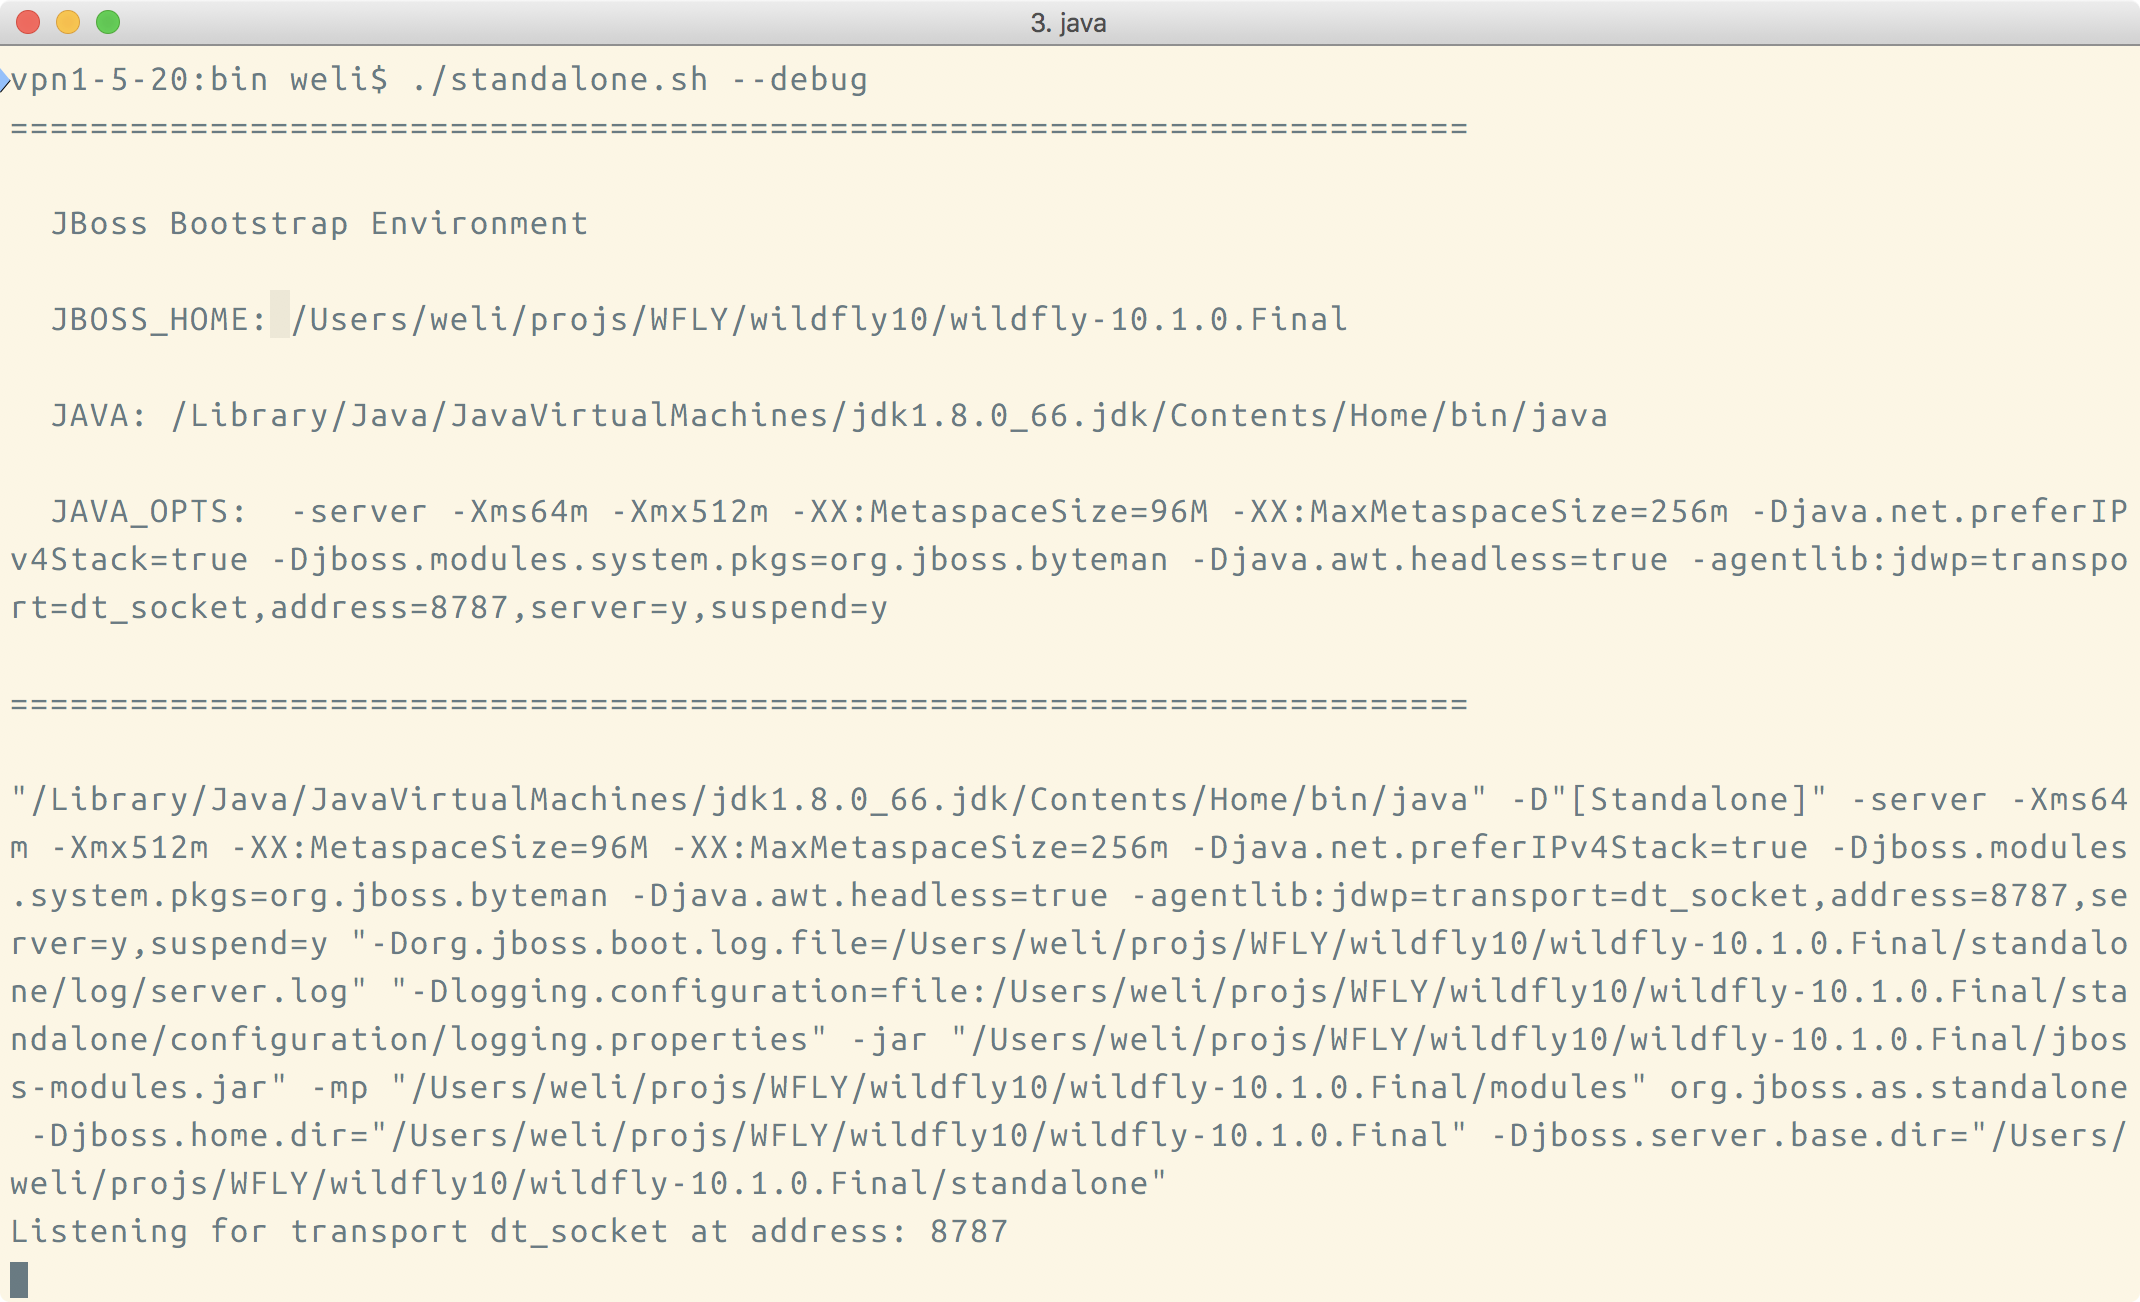
From the above screenshot, we can see the server is suspended and
waiting for the a debugger to connect to port 8787. Now we can come to the IDE side and configure the remote debugger. In IntelliJ, I can open the Edit Configuration tab:
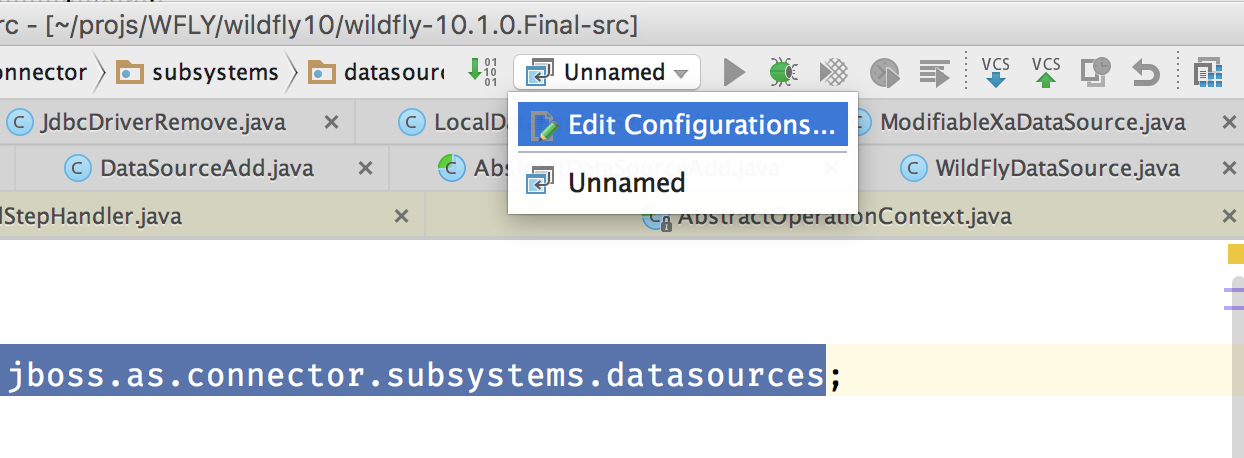
After clicking the Edit Configuration tab as shown in above screenshot, we will enter the Run/Debug Configuration window. In this window, we need to add a Remote Debug configuration to connect to the suspended Wildfly server. Here is the screenshot that shows how to configure it:
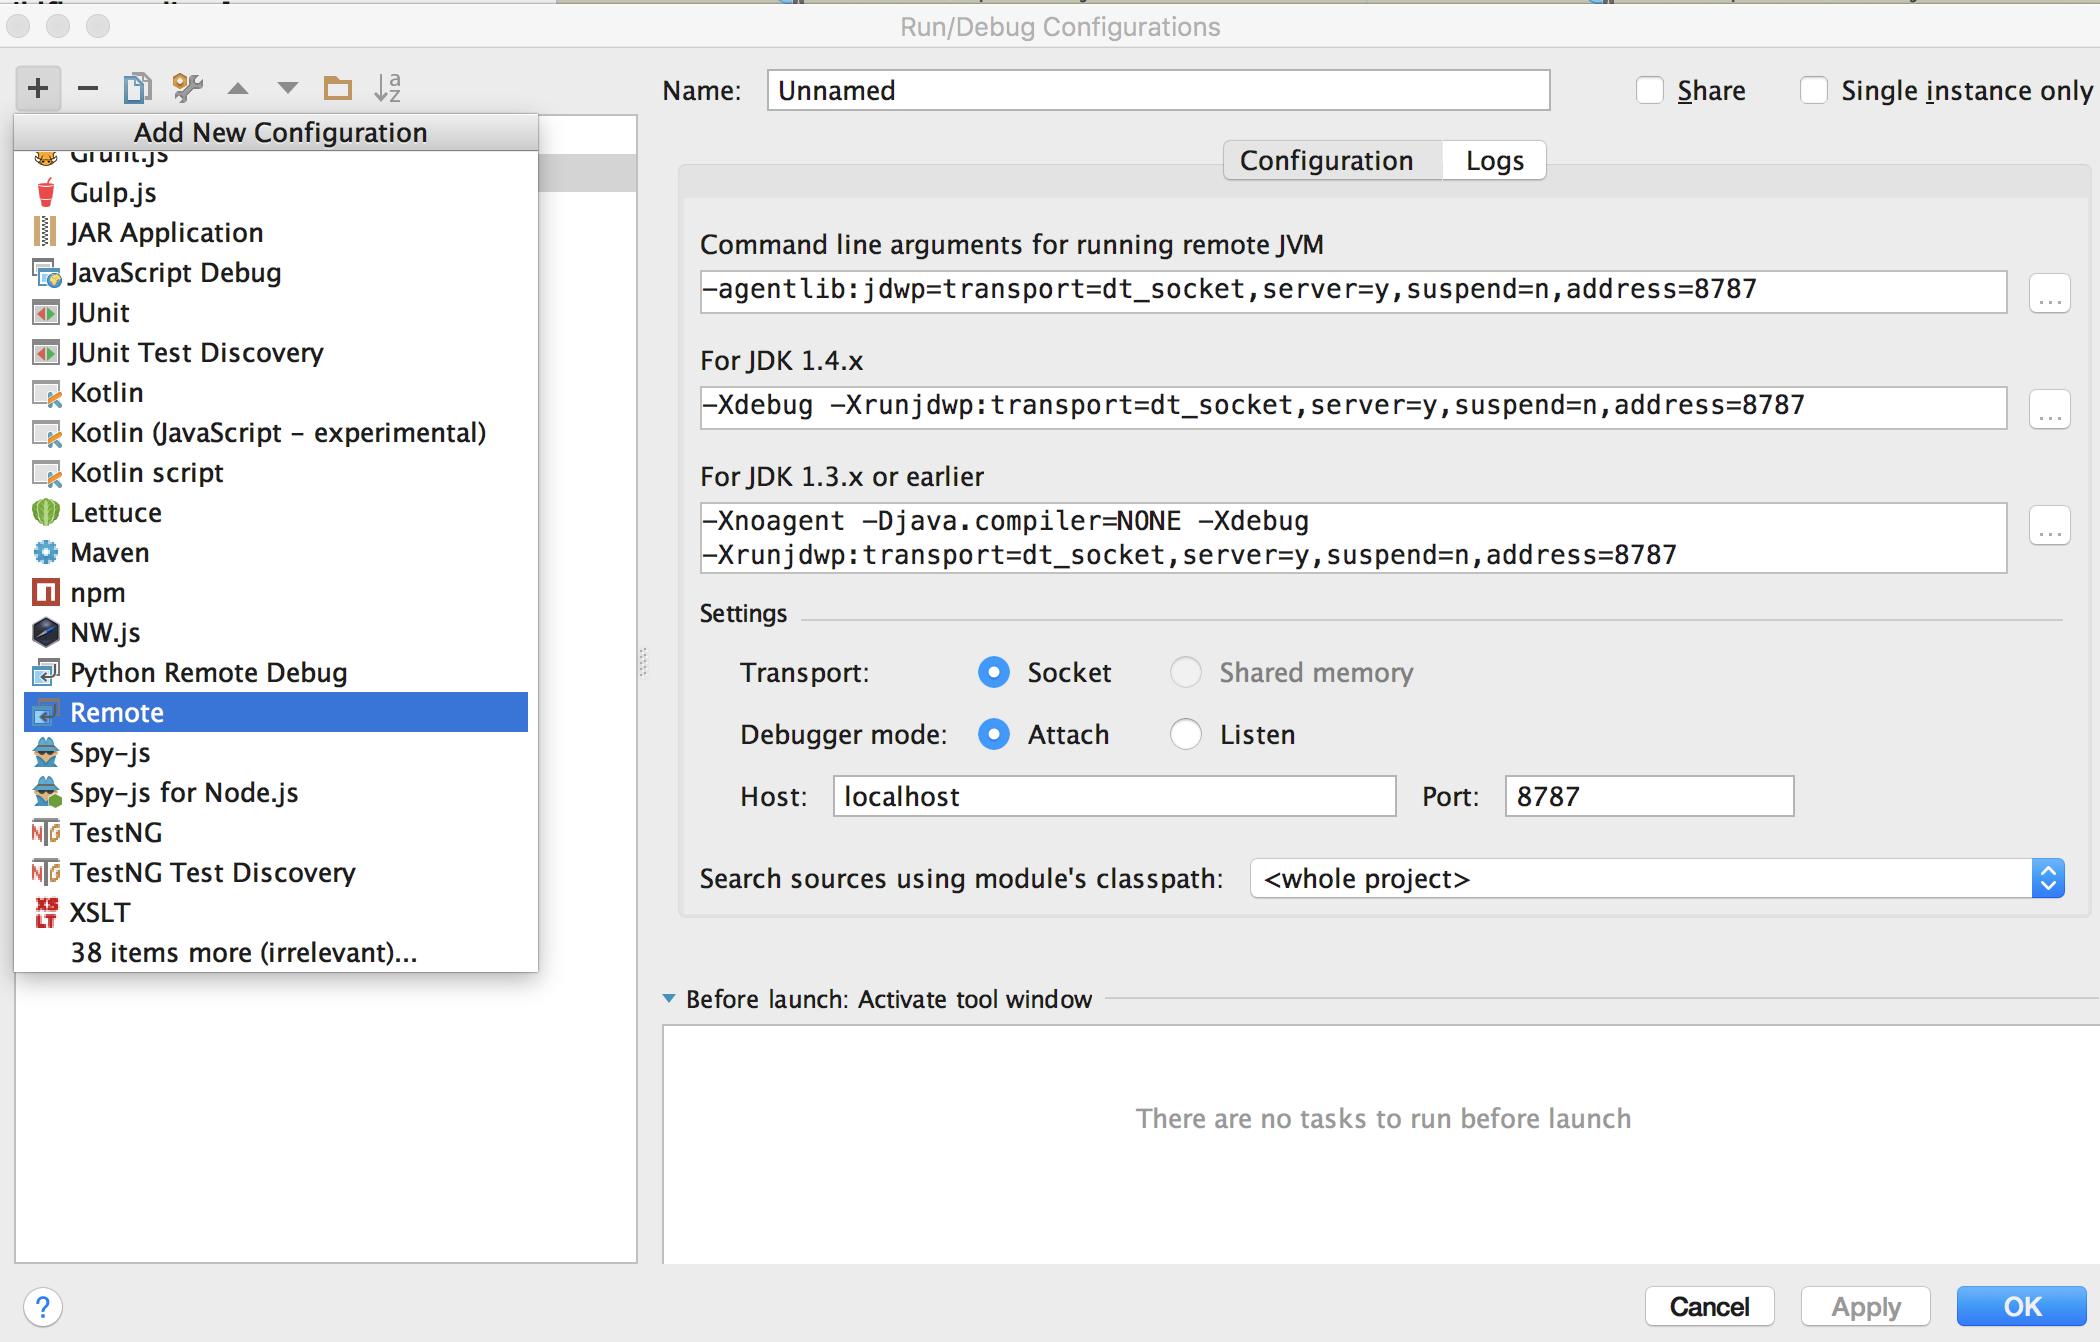
After clicking the Remote item as shown in above, we can start the remote debug configuration. Here is the screenshot to do so:
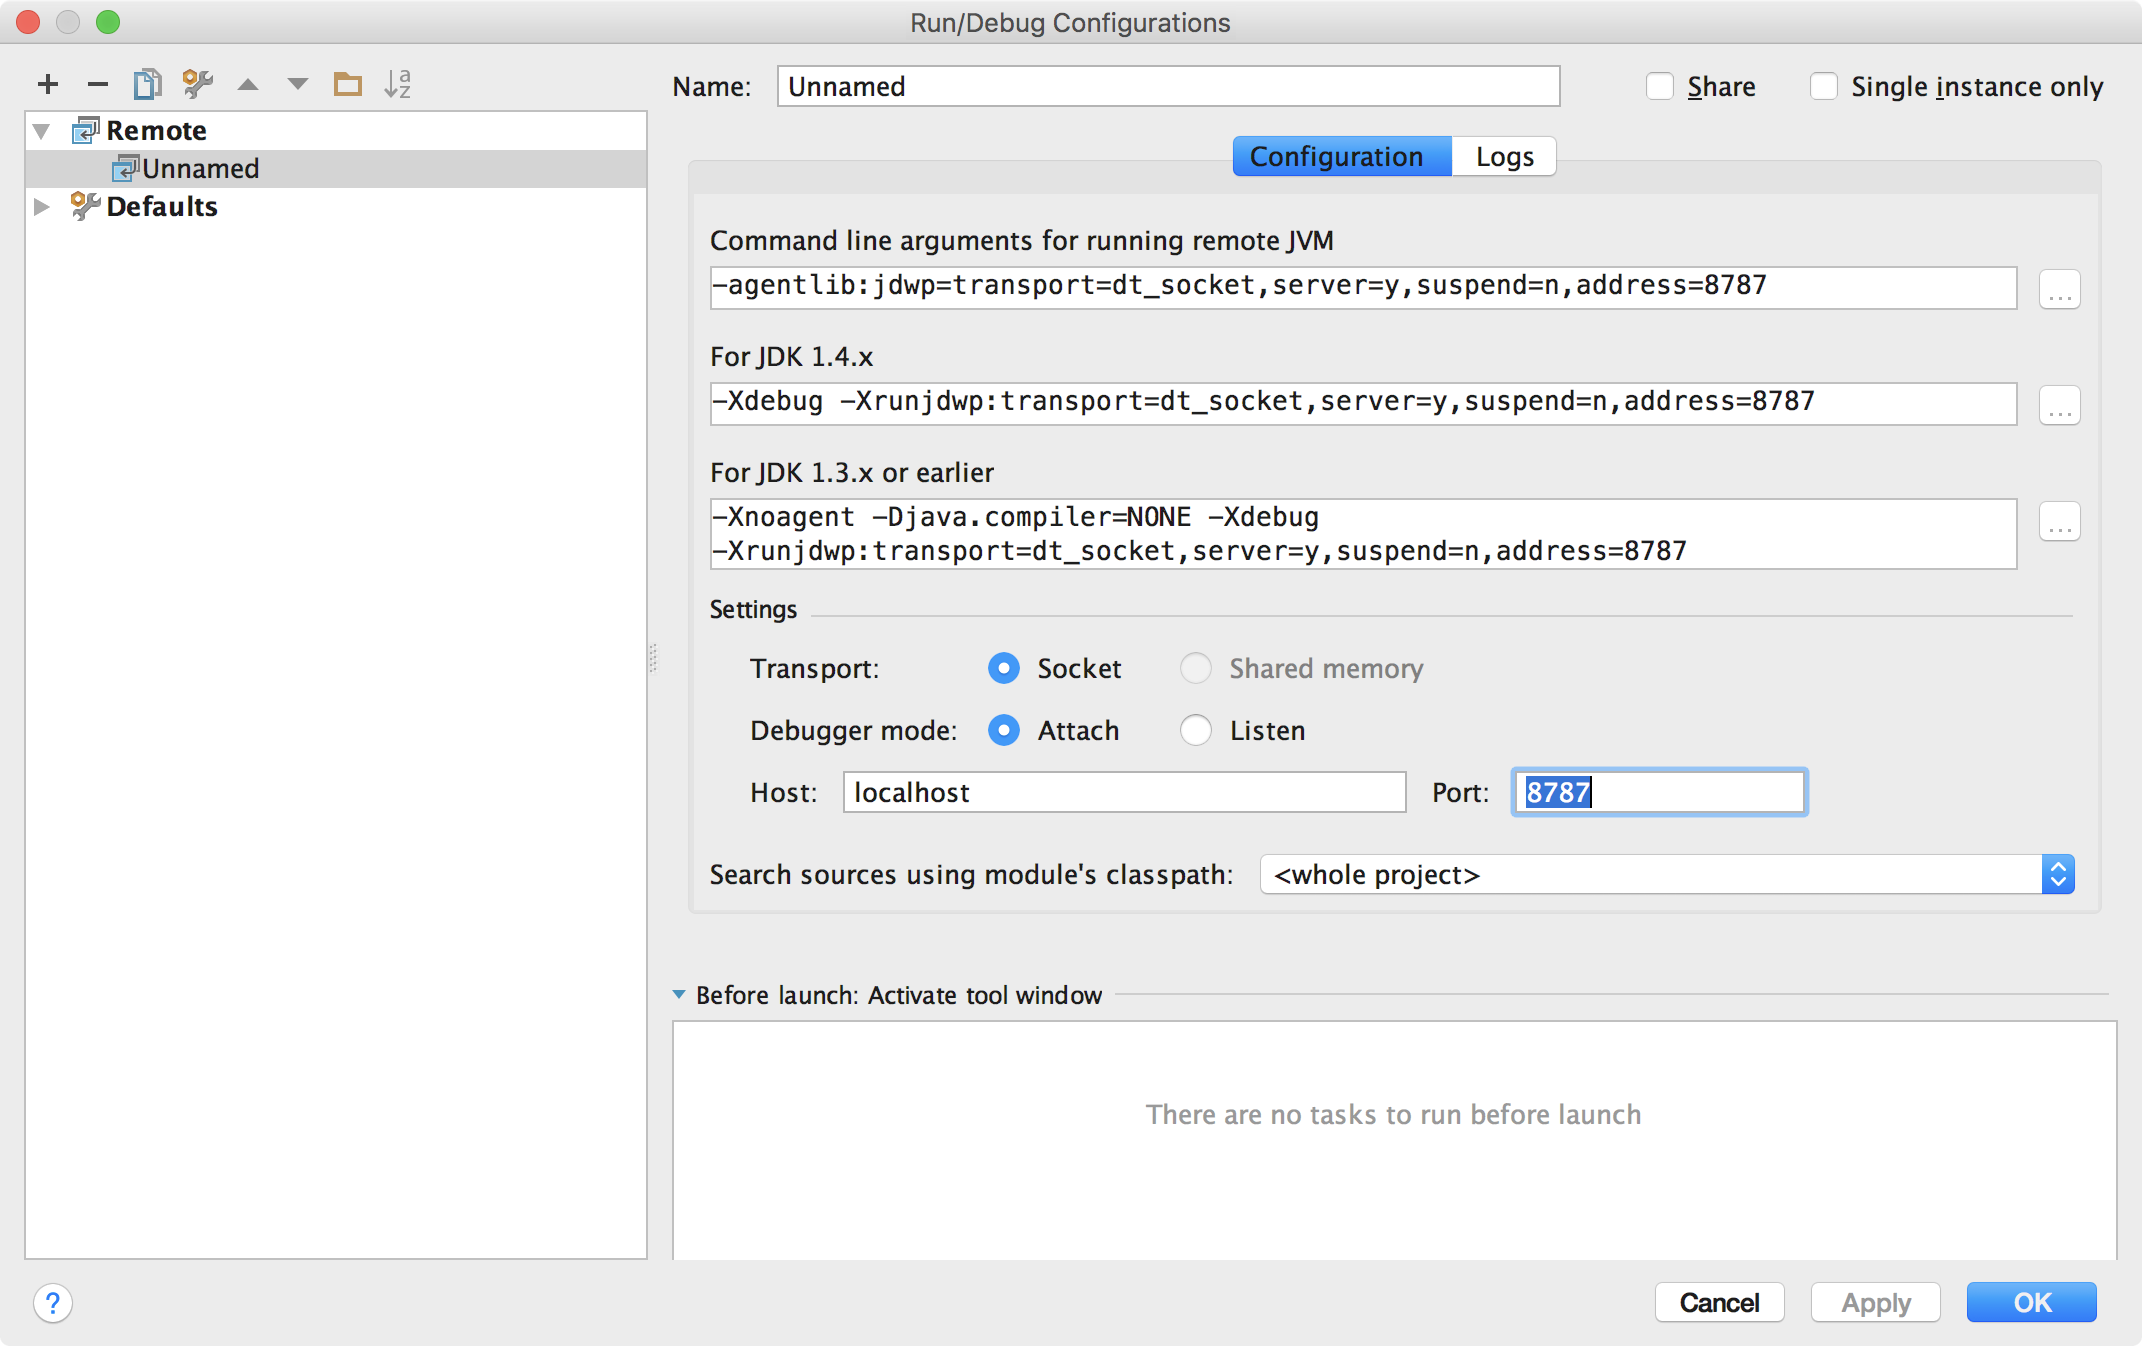
In above configuration, we only need to change the port to 8787, because the server side is listening to this port for remote debugger to connect. After the configuration is done, we can click the OK button, and start to use it. Here is the screenshot:
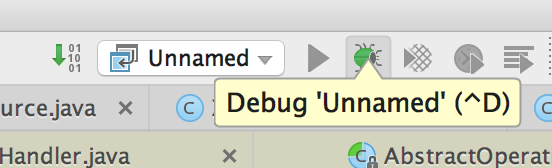
As the screenshot shown above, we can click the bug icon to start the remote debugger, and this will trigger the server side to go on executing until reaching the breakpoint. Here is the screenshot to show the server startup process reached at the breakpoint:
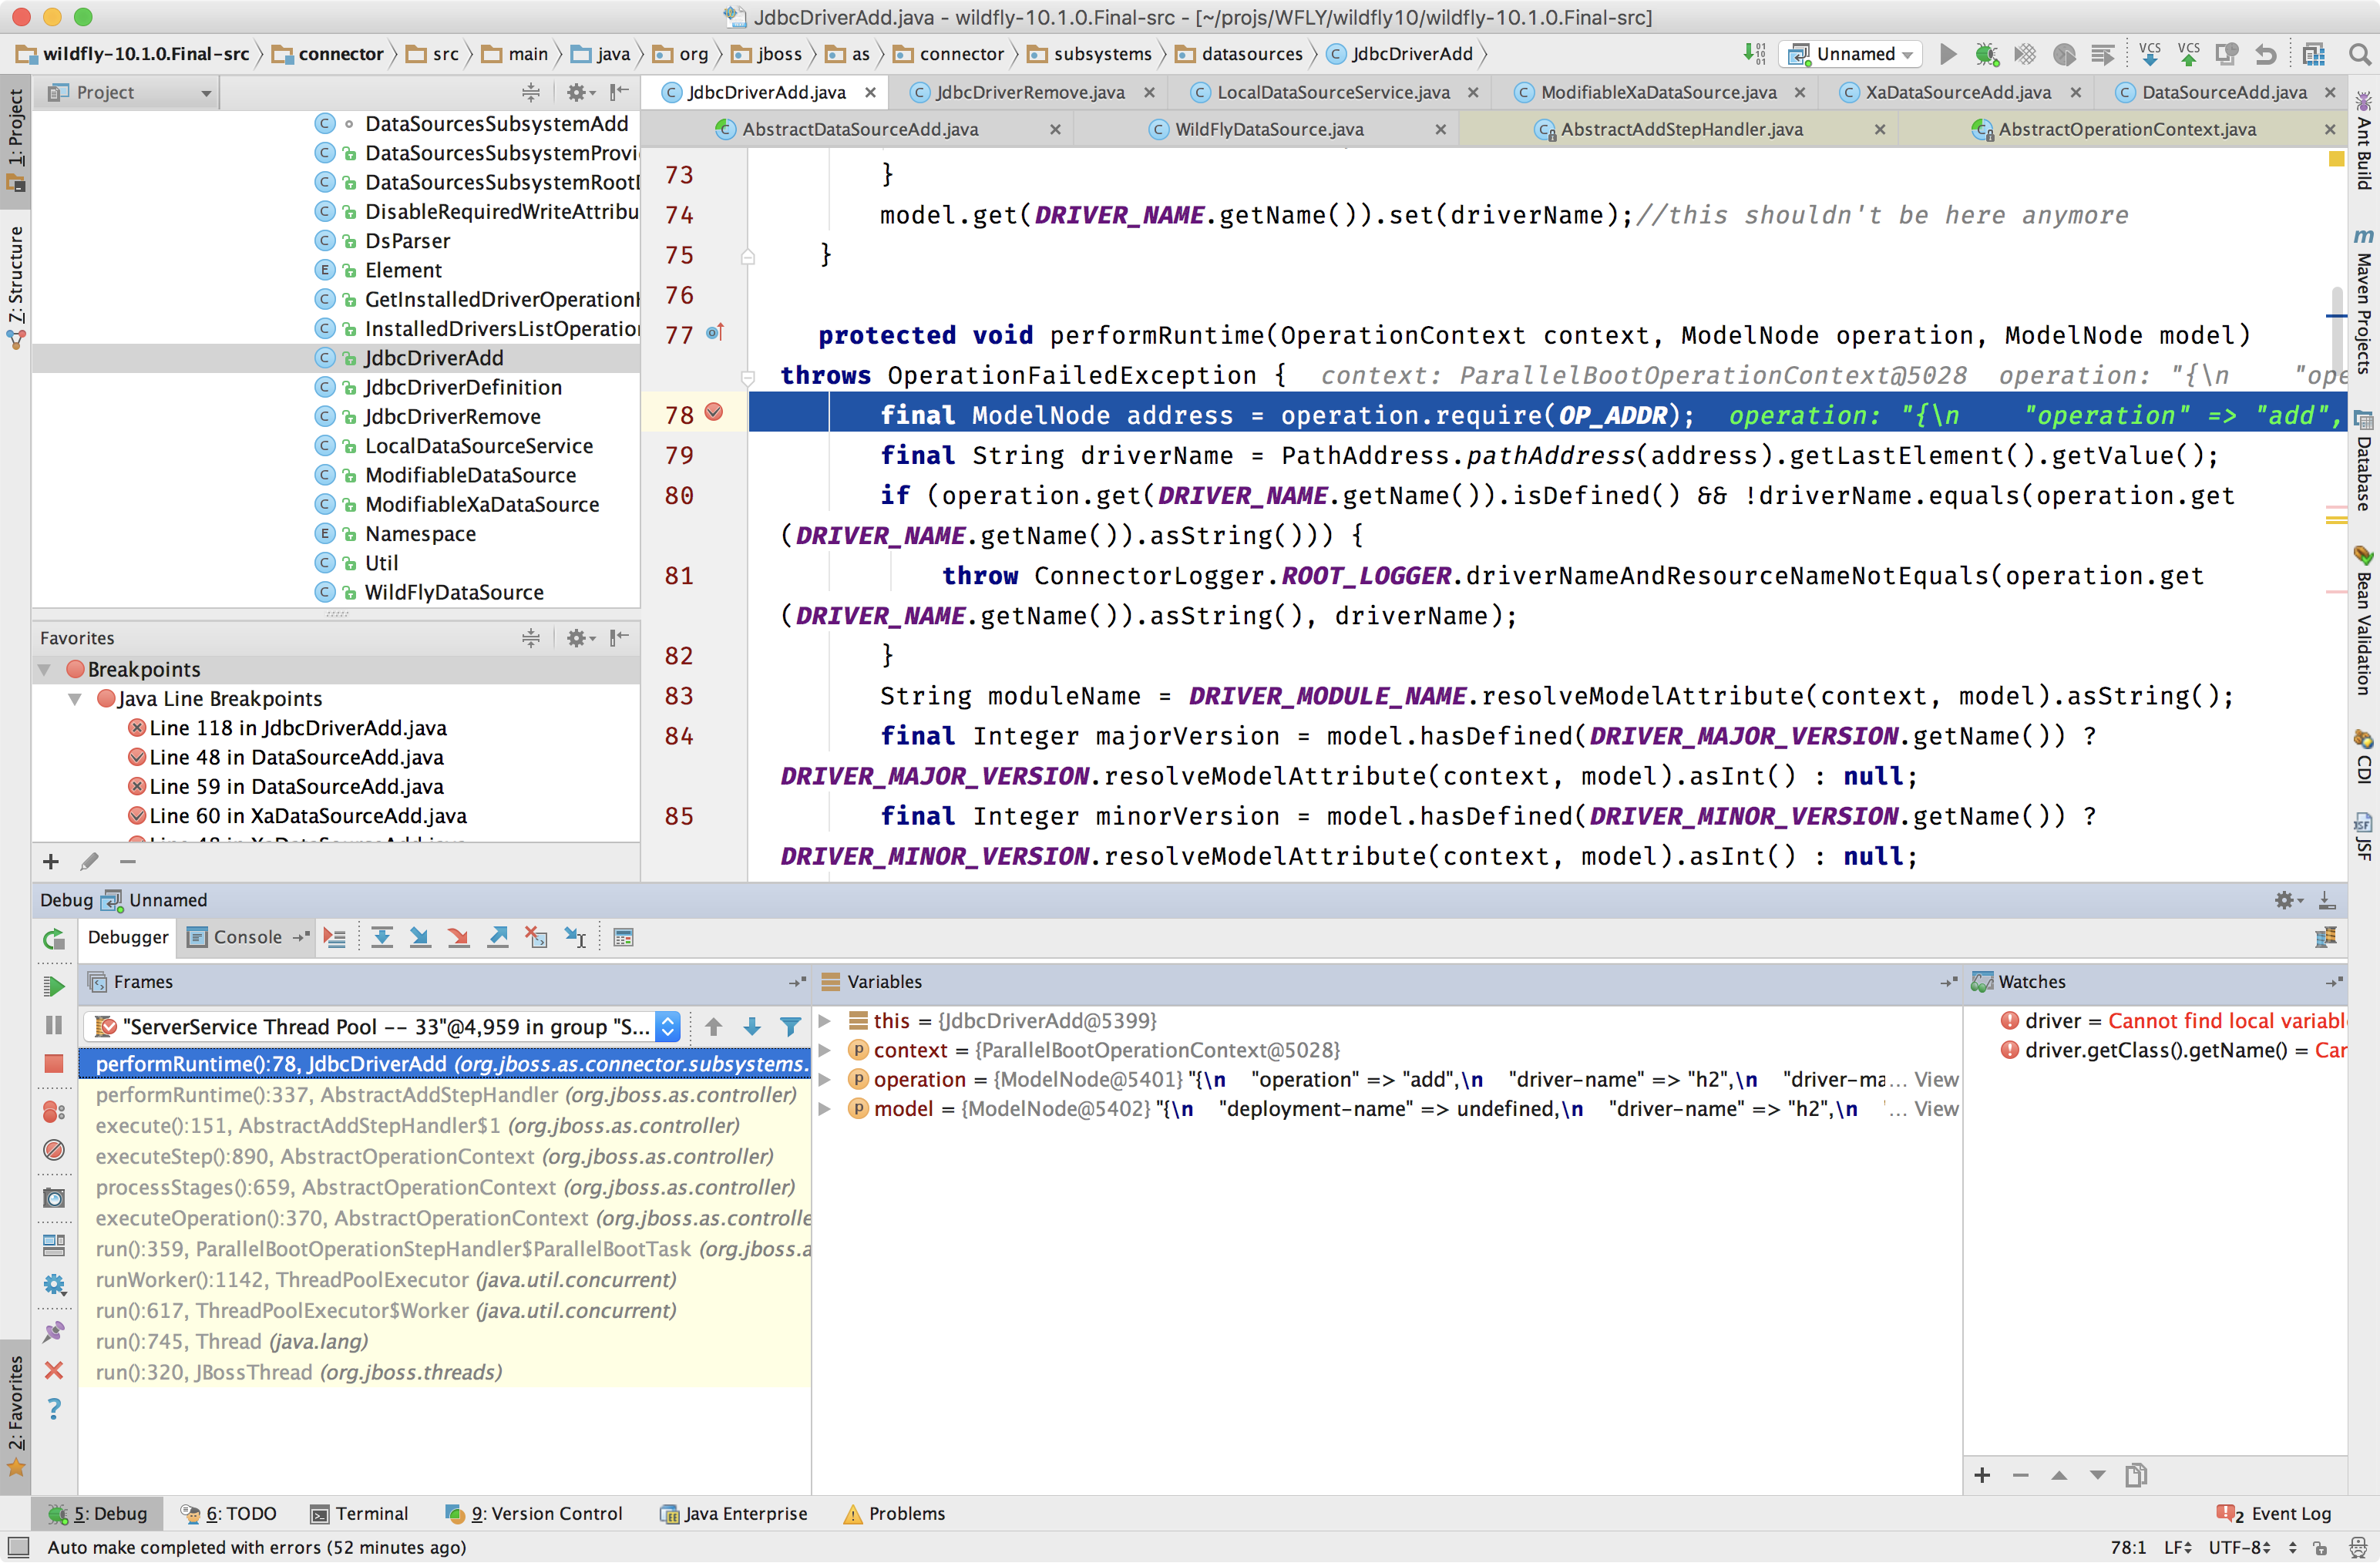
The above process shows us how to troubleshoot the Wildfly startup process. We will this method to analyze the Wildfly source code and see how it works in runtime. This article is a basis for the future topics I’d like to write.