coredump的生成与使用
本文承接上文对Segment fault的介绍,来讲解程序在产生segment fault后,如何生成coredump file,并通过coredump file进行程序的调试。
操作系统会在默认情况下,对每一个process加一些限制条件,限制process对系统资源的使用,从而防止一个程序耗尽系统资源,导致整个系统不稳定。
可以使用ulimit命令来查看这些限制:
$ ulimit -a
core file size          (blocks, -c) 0
data seg size           (kbytes, -d) unlimited
file size               (blocks, -f) unlimited
max locked memory       (kbytes, -l) unlimited
max memory size         (kbytes, -m) unlimited
open files                      (-n) 7168
pipe size            (512 bytes, -p) 1
stack size              (kbytes, -s) 8192
cpu time               (seconds, -t) unlimited
max user processes              (-u) 2837
virtual memory          (kbytes, -v) unlimited
可以看到这些限制涉及到方方面面,比如能够打开的最多文件数,一个用户能最多同时开的processes数,等等。关于ulimit能够设置的具体内容,可以察看它的man page,这篇文章里不展开讲。
需要注意的是,这个ulimit产生的限制,是针对当前的terminal生效,而不是全局生效的,所以我们修改完限制后,就要在当前terminal环境下做工作。
在上面的限制中,可以看到core file size这条设置。这条设置用来限制我们的processes可以产生的core dump文件大小。可以看到默认大小是0,也就是不能产生core file。我们可以通过ulimit命令解除这个限制:
$ ulimit -c unlimited
然后确认限制已经解除:
$ ulimit -a | grep core
core file size          (blocks, -c) unlimited
此时我们重新执行前一篇文章1中的代码:
#include <stdio.h>
#include <unistd.h>

int main() {
  printf("PID of the process: %d\n", getpid());
  char *p = "hello";
  printf("addr of string: %p\n", p);

  printf("Press [Enter] key to generate segment fault...\n");
  getchar();

  *p = 'H'; // 尝试对只读区域的内存进行写入操作时,会产生Segment fault
}
但是这回我们要加上-g选项来编译这个代码:
$ cc 0g segfault.c -o segfault.debug
以下是编译情况:
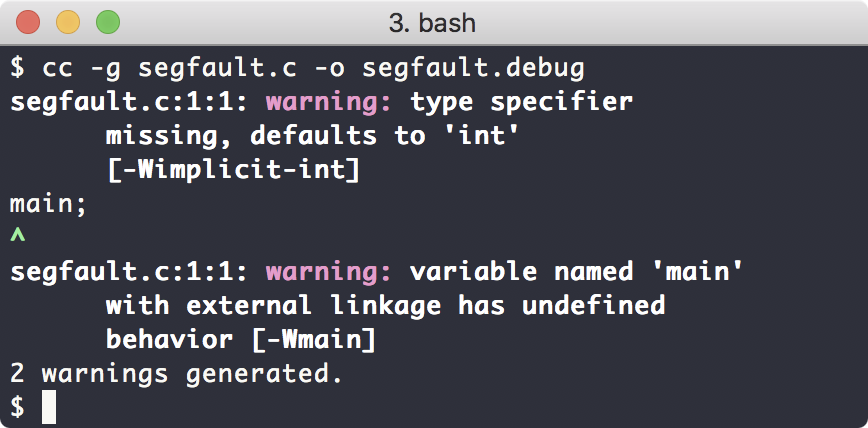
这样,这个编译出来的程序,就可以带有debuginfo了。所谓debuginfo,就是把程序的源代码,以及源代码与实际的汇编指令对应的代码的映射关系,这些数据,给embed到编译好的程序里面去。这样,后续就可以使用调试工具方便下断电,调试代码,查看变量的runtime时的值了。
我们此时可以执行这个带debuginfo的program,让它产生segment fault:
$ ./segfault.debug
PID of the process: 59731
addr of string: 0x106c41f62
Press [Enter] key to generate segment fault...

Bus error: 10 (core dumped)
可以看到,这回的提示信息写着core dumped。也就是说,这次的segment fault,生成了core dump file。因此可以确定,我们的ulimit设置是正确的。
MacOS系统下,core dump file默认保存在/cores目录:
$ ls /cores
core.126   core.4407  core.4673
core.24268 core.4541  core.59713
core.24378 core.4599  core.59731
这个目录里面保存了core dump files,并且每一个文件是按照对应的,产生了segement fault的process的编号来保存的。我们上面的程序的process id是59731,那么对应的core dump file就是core.59731。
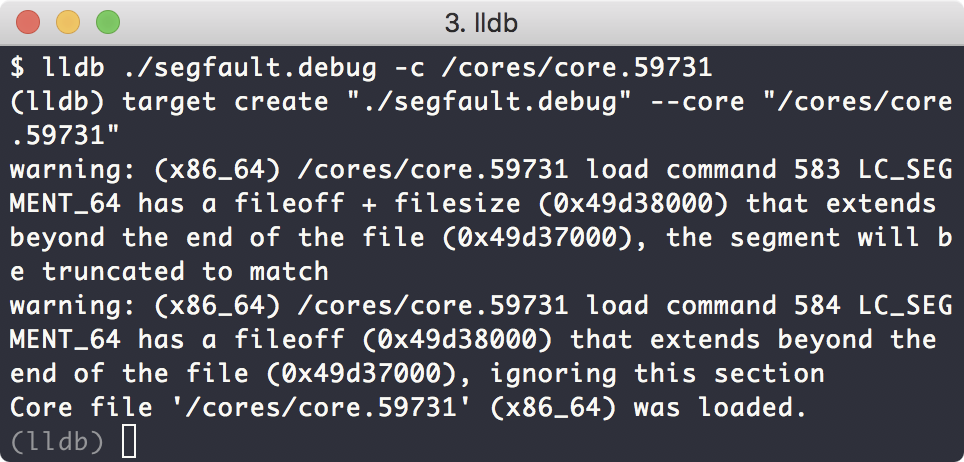
此时可以使用lldb命令加载可执行文件,并载入对应的core dump file:
$ lldb ./segfault.debug -c /cores/core.59731
下面是加载情况:
此时程序被停在发生segment fault的前一刻,此时程序的运行时数据,和所在的代码行数,都被lldb加载了。这些数据都是由coredump file来提供的。我们可以执行bt命令,查看此时的程序运行状态:
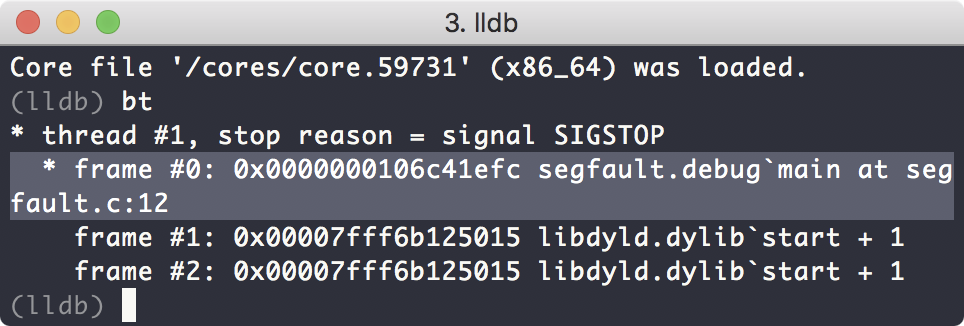
可以看到程序时停在了main函数的第12行代码处。
我们可以使用l命令查看源代码:
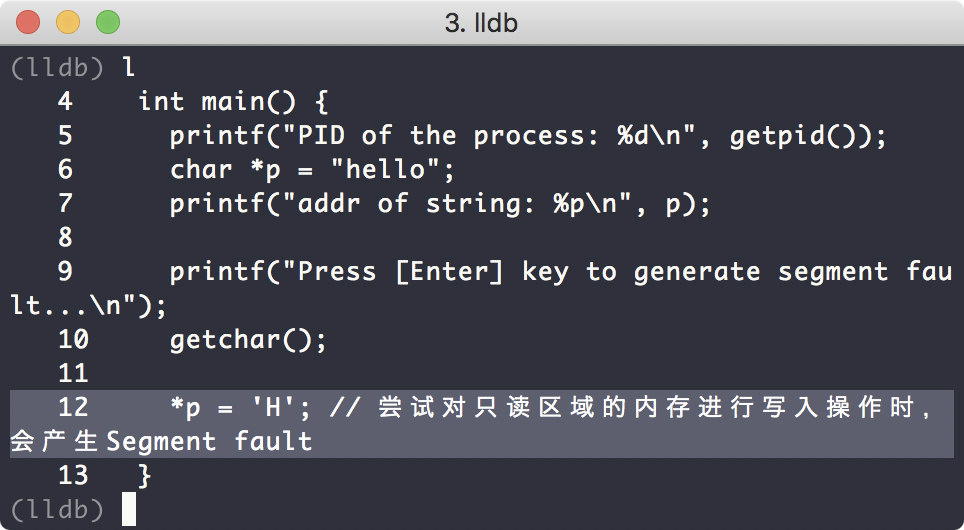
可以看到第12行代码就是产生segment fault的地方。我们也可以使用p指令查看程序此时的各种数据:
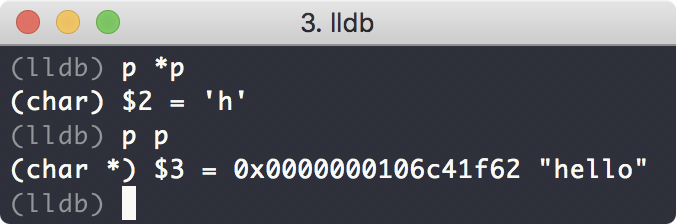
lldb或者gdb是非常强大的调试工具,很多图形化的开发工具,比如Xcode,实际上也是调用这两个基础工具的接口,提供给用户调试代码的功能。因此系统学好lldb以及gdb会是很实用的技能。
本文介绍了coredump的概念和相关的使用流程,希望能够对大家有所帮助。
-
http://weinan.io/2018/06/20/segfault.html ↩
- 上一篇 为树莓派编译Kdump kernel
- 下一篇 C的preprocessing过程