使用OpenTracing的JAX-RS实现模块
OpenTracing是一个开源的,分布式的tracing standard1。很多项目都实现这个标准,比如eclipse社区的Microservices OpenTracing2。最近在参与这个标准的jax-rs实现,在这里写一些心得。
这篇文章里试玩一下这个标准的JAX-RS实现模块3。因为这个项目在我写这篇文章的时候还在开发阶段,所以需要补充一些代码进去,所以我把它fork到了自己的Github空间里4。这篇文章使用我的这个forked项目。
把这个forked project给forked到本地以后,可以看一下里面的关键代码。在这篇文章里要玩一下项目当中的example子项目,可以先看一下这里面的JerseyConfig这个class:
package io.opentracing.contrib.jaxrs2.example.spring.boot;

import io.opentracing.Tracer;
import io.opentracing.contrib.jaxrs2.client.ClientTracingFeature.Builder;
import io.opentracing.contrib.jaxrs2.itest.common.rest.TestHandler;
import io.opentracing.contrib.jaxrs2.server.ServerTracingDynamicFeature;
import javax.inject.Inject;
import javax.ws.rs.ApplicationPath;
import javax.ws.rs.client.Client;
import javax.ws.rs.client.ClientBuilder;
import org.glassfish.jersey.server.ResourceConfig;
import org.springframework.stereotype.Component;

/**
 * @author Pavol Loffay
 */
@Component
@ApplicationPath("/")
public class JerseyConfig extends ResourceConfig {

	@Inject
	public JerseyConfig(Tracer tracer) {
		Client client = ClientBuilder.newClient();
		client.register(new Builder(tracer).build());
		packages("io.opentracing.contrib.jaxrs2.example.spring.boot");

		register(new ServerTracingDynamicFeature.Builder(tracer)
				.build());

		register(new TestHandler(tracer, client));
	}
}
在上面的代码中,packages(...)方法是为了把相关package里面的HelloResource给注册进服务器,这样才能进行demo;接下来的register(...)方法把ServerTracingDynamicFeature给注册进服务器,这样就等于服务端就开启了tracing能力,等下展示例子会看到。
ServerTracingDynamicFeature接收一个tracer,这个tracer是在Configuration里面注入的:
package io.opentracing.contrib.jaxrs2.example.spring.boot;

import org.springframework.context.annotation.Bean;

import io.opentracing.Tracer;

/**
 * @author Pavol Loffay
 */
@org.springframework.context.annotation.Configuration
public class Configuration {

	@Bean
	public Tracer tracer() {
		return new LoggingTracer();
	}
}
关于LoggingTracer,在下篇中给出具体分析。这篇文章最后我们实操一下这个项目。首先是编译整个项目:
$ mvn install -Dmaven.test.skip=true
...
[INFO] Reactor Summary:
[INFO]
[INFO] io.opentracing.contrib:opentracing-jaxrs-parent .... SUCCESS [  0.207 s]
[INFO] opentracing-jaxrs2 ................................. SUCCESS [  0.679 s]
[INFO] opentracing-jaxrs2-itest-parent .................... SUCCESS [  0.006 s]
[INFO] opentracing-jaxrs2-itest-common .................... SUCCESS [  0.099 s]
[INFO] opentracing-jaxrs2-itest-jersey .................... SUCCESS [  0.126 s]
[INFO] opentracing-jaxrs2-itest-resteasy .................. SUCCESS [  0.107 s]
[INFO] opentracing-jaxrs2-itest-apache-cxf ................ SUCCESS [  0.064 s]
[INFO] opentracing-jaxrs2-itest-auto-discovery ............ SUCCESS [  0.770 s]
[INFO] opentracing-jaxrs2-example-spring-boot ............. SUCCESS [  0.953 s]
[INFO] ------------------------------------------------------------------------
[INFO] BUILD SUCCESS
[INFO] ------------------------------------------------------------------------
[INFO] Total time: 3.264 s
[INFO] Finished at: 2017-12-27T20:50:01+08:00
[INFO] Final Memory: 38M/550M
[INFO] ------------------------------------------------------------------------
然后进入examples/spring-boot目录,启动并运行spring server:
$ mvn spring-boot:start
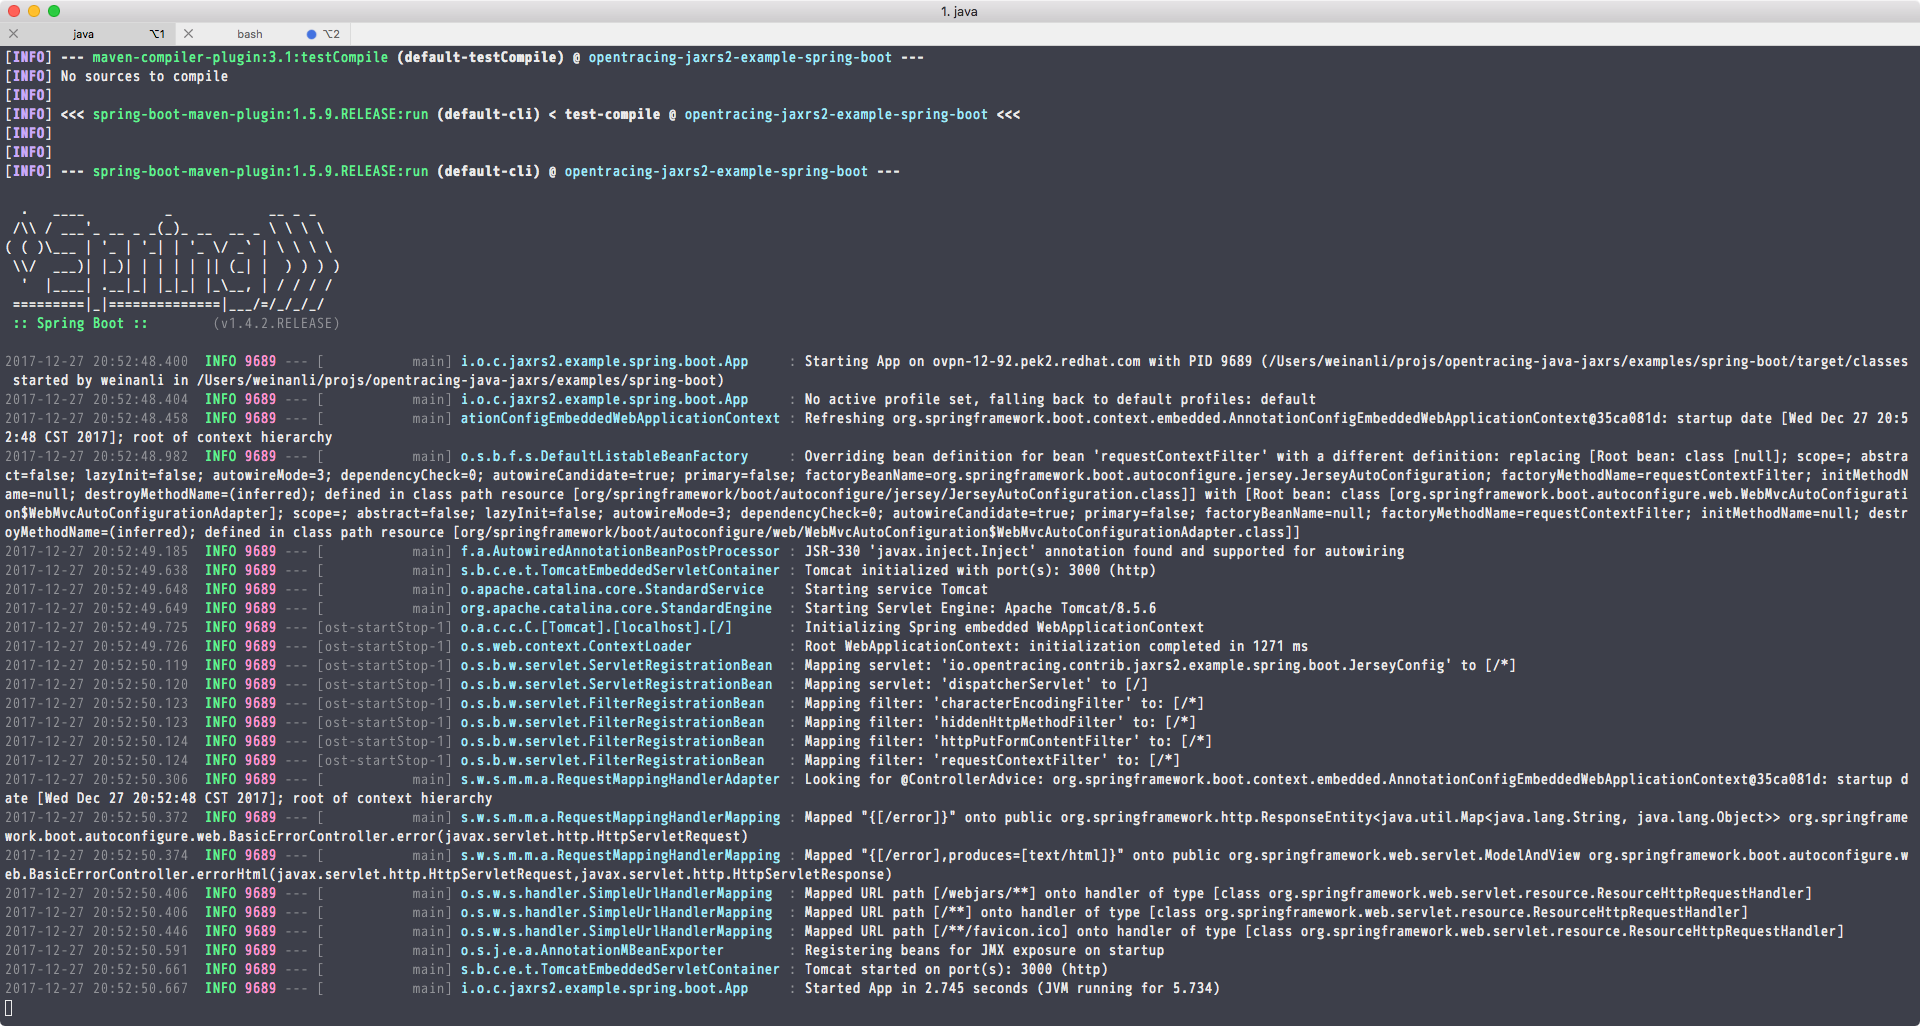
运行起来的效果如下:
服务启动后,使用curl来访问服务端:
$ curl -iv http://localhost:3000/hello
*   Trying ::1...
* TCP_NODELAY set
* Connected to localhost (::1) port 3000 (#0)
> GET /hello HTTP/1.1
> Host: localhost:3000
> User-Agent: curl/7.54.0
> Accept: */*
>
< HTTP/1.1 200
HTTP/1.1 200
< Content-Type: text/xml
Content-Type: text/xml
< Content-Length: 13
Content-Length: 13
< Date: Wed, 27 Dec 2017 12:55:16 GMT
Date: Wed, 27 Dec 2017 12:55:16 GMT

<
* Connection #0 to host localhost left intact
Hello, world!$
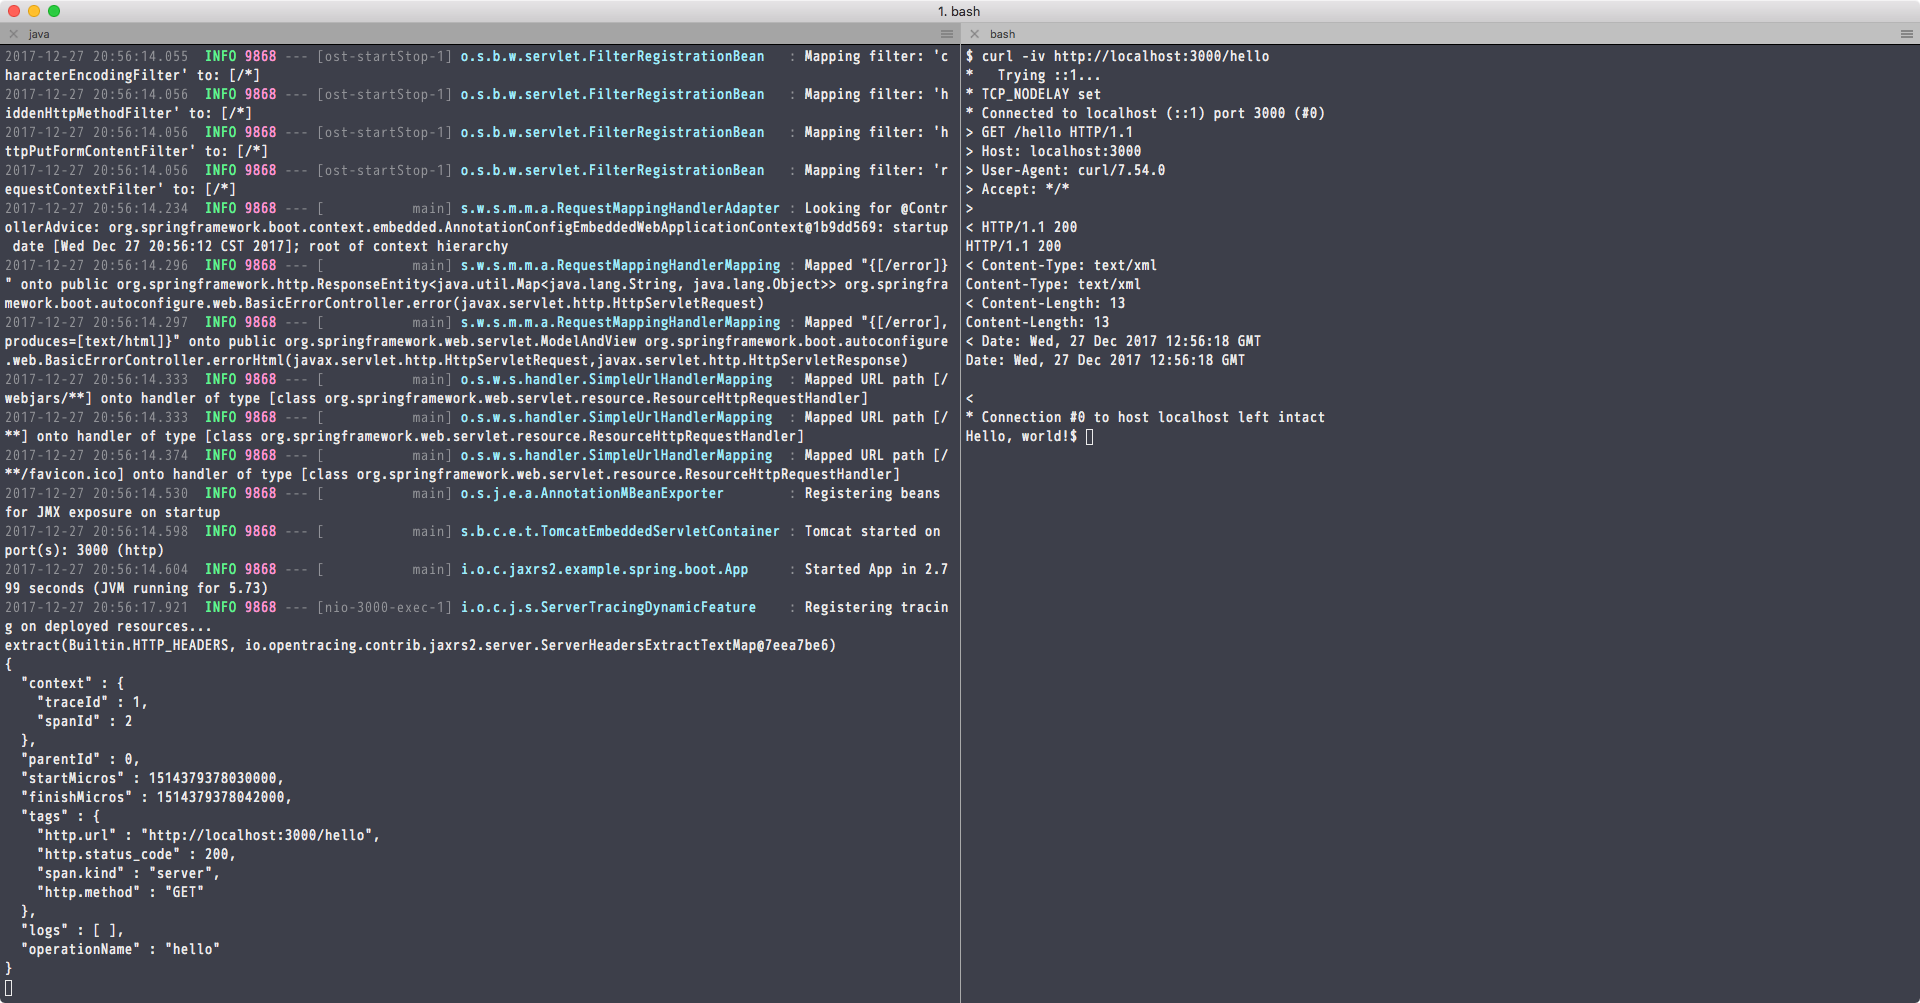
此时查看服务端的tracing输出:
extract(Builtin.HTTP_HEADERS, io.opentracing.contrib.jaxrs2.server.ServerHeadersExtractTextMap@280ba5f0)
{
  "context" : {
    "traceId" : 1,
    "spanId" : 2
  },
  "parentId" : 0,
  "startMicros" : 1514379316262000,
  "finishMicros" : 1514379316274000,
  "tags" : {
    "http.url" : "http://localhost:3000/hello",
    "http.status_code" : 200,
    "span.kind" : "server",
    "http.method" : "GET"
  },
  "logs" : [ ],
  "operationName" : "hello"
}
可以看到上面的服务端有了json格式的tracing输出内容,这是LoggingTracer和它后面的opentracing框架所提供给我们的,在下篇中具体说明。下面是客户端和服务端在我机器上运行的截图:
先讲这么多。
- 上一篇 Clojure的Seq数据结构
- 下一篇 日语学习笔记・07